


Disaggregation of child health statistics by sex is important in order to identify gender bias in health intervention coverage, and in outcomes such as morbidity, mortality and nutritional status among children under the age of five years. Gender bias is a multidimensional social construct, in which different values are attributed to men and women in a given society, which can lead to preferential treatment of children of a given sex [1,2]; the use of this concept refers to a system of relations including sex, but goes beyond biological differences [3]. The study of gender bias in child health is affected by the greater biological vulnerability of boys compared to girls; in societies where there is no evidence of discrimination, boys show higher mortality rates than girls [4,5].
Two recent analyses assessed gender bias in the coverage of essential child health interventions in low– and middle–income countries (LMICs) [6,7]. Essential interventions may be classified as preventive (for example, measles vaccination, early initiation of breastfeeding, exclusive breastfeeding from 0–5 months, and use of insecticide treated bednets) or curative (use of antimalarials, careseeking for pneumonia, oral rehydration therapy, etc.) A UNICEF report showed no difference between girls and boys in terms of the seven interventions listed above [6]. There were also no differences in undernutrition (stunting, wasting or underweight). The numbers of countries included in these analyses ranged from 23 to 80 [6]. However, in spite of the lack of gender bias at national level, differences may exist at the subnational level, particularly among disadvantaged groups [8].
A recent systematic review investigated sex differences in hospitalizations for diarrhea, pneumonia and malaria in LMICs, and showed higher admission rates for boys, and higher case–fatality rates for girls [7]. However, hospital admissions are not a good indicator to study gender bias, because admission depends both on severity of the illness – which is likely to be greater for boys – and on careseeking by the caregivers [7]. Comparing careseeking rates among boys and girls for all cases of defined diseases or conditions is likely to be more useful in terms of detecting gender bias. In the same study, the authors analyzed data from 67 Demographic and Health Surveys (DHS) to investigate sex differences in careseeking by type of provider for diarrhea, fever, and pneumonia. Overall, more boys were taken to a health–care facility compared to girls [7].
Careseeking indicators are based on children who presented symptoms for each illness, usually in the two weeks before a survey. In these cases, the number of children is small, which leads to wide confidence intervals for these indicators, and may fail to detect differences between boys and girls as statistically significant due to low power [9].
We attempt to overcome this limitation by measuring sex differences using a composite careseeking indicator for three common childhood illnesses or symptoms. In addition, given the conflicting results of the two above–mentioned analyses, we expand our investigation to also assess whether these differences vary by wealth quintile, and whether sex differences in careseeking are associated with country characteristics such as income, religion and gender inequality indices. By doing so, we test the hypotheses that socioeconomic and related factors may modify the extent of gender bias in careseeking.
We analyzed data from nationally–representative Demographic and Health Surveys (DHS) conducted in low– and middle–income countries. We included all surveys with public–domain datasets available on the DHS website (http://dhsprogram.com/) as of May 2016, which had all the variables required for the analyses.
DHS asks mothers or caretakers of children under five years of age about diarrhea, fever, and symptoms of pneumonia (see Table S1 in Online Supplementary Document(Online Supplementary Document) ). We used a composite careseeking indicator; the numerator was the number of children in a survey who were taken to an appropriate health care provider (defined by each country), during recent episodes of diarrhea, fever or suspected pneumonia, and the denominator was the number of children for which such an episode was reported during the two weeks preceding the interview. Pharmacies, shops and traditional practitioners were not considered appropriate providers.
The outcome variable was the proportion of children with symptoms who were taken to an appropriate provider. This was calculated separately for boys and girls in each survey, both at the national level and within each wealth quintile. Wealth indices were calculated for each survey through principal component analysis of household assets and building characteristics [10–12]. The first component resulting from the analysis was divided into quintiles, with Q1 representing the poorest, and Q5 the wealthiest, 20% of all families.
For the descriptive analyses, we selected the most recent survey from each country, from 2005 to 2014. Differences between the sexes in each country were assessed using chi–squared tests. Sex ratios were calculated for each survey by dividing careseeking proportions in girls and in boys, with values below 1.0 indicating gender bias against girls. The 95% confidence intervals for sex ratios were calculated using a jackknife approach based on repeated sub–sampling within the full survey sample. Interactions between wealth quintiles and sex of the child were assessed using Poisson regression with careseeking as the outcome.
Countries with more than one survey were included in the analyses of global time trends in careseeking between 1994 and 2014, using linear multilevel regression models with surveys as level one units and countries as level two units. We fitted separate trends for boys and for girls.
Ecological analyses were carried out with careseeking sex ratios as the outcome, based on the most recent survey for each country. The following explanatory variables were selected: region of the world according to UNICEF classification; religion (predominant and percentage in the population); country income groups; Gross Domestic Product per capita in USD; Gini coefficient of income inequality; and three indices related to gender equity (Gender Inequality Index, Gender Development Index, and Global Gender Gap Index) (see Table S2 in Online Supplementary Document(Online Supplementary Document) for full definitions and data sources) [13–20]. Associations between careseeking sex ratios and categorical explanatory variables were analyzed using analysis of variance (ANOVA), and those with continuous explanatory variables using Pearson´s correlation.
All analyses were carried out using Stata version 13.1 (StataCorp LP, College Station, Texas, USA), and considered the complex sampling structure of the surveys and the sampling weights.
A total of 57 countries had DHS data sets since 2005 with the required variables. The median survey year was 2012. Sample sizes ranged from 1450 (Armenia) to 48 679 (India) children under five years ( Table 1 ). The median sample size was 7526 children and the interquartile range was 5054 to 10 935.
| Country | Year | World Region (UNICEF) | Income group (World Bank) | Children under five years (n) | Children with diarrhea, fever or suspect pneumonia (n) | Careseeking sex ratio (CI 95%) | P–value | |||
|---|---|---|---|---|---|---|---|---|---|---|
| Total | Boys | Girls | ||||||||
| Albania | 2008 | CEE & CIS | Upper middle | 1586 | 267 | 145 | 122 | 0.9 | (0.72–1.07) | 0.292 |
| Armenia | 2010 | CEE & CIS | Lower middle | 1450 | 290 | 153 | 137 | 0.92 | (0.66–1.19) | 0.599 |
| Azerbaijan | 2006 | CEE & CIS | Upper middle | 2196 | 405 | 227 | 178 | 0.82 | (0.57–1.06) | 0.183 |
| Bangladesh | 2014 | South Asia | Low | 7567 | 3089 | 1614 | 1475 | 0.99 | (0.84–1.15) | 0.984 |
| Benin | 2011 | West & Central Africa | Low | 12 679 | 1857 | 954 | 903 | 0.96 | (0.83–1.08) | 0.521 |
| Burkina Faso | 2010 | West & Central Africa | Low | 13 716 | 4175 | 2143 | 2032 | 0.94 | (0.88–1.00) | 0.099 |
| Burundi | 2010 | Eastern & Southern Africa | Low | 7231 | 3713 | 1864 | 1849 | 0.96 | (0.90–1.02) | 0.302 |
| Cambodia | 2014 | East Asia & Pacific | Low | 6971 | 2248 | 1182 | 1066 | 1.09 | (0.98–1.19) | 0.076 |
| Cameroon | 2011 | West & Central Africa | Lower middle | 10 734 | 4443 | 2231 | 2212 | 0.93 | (0.81–1.04) | 0.263 |
| Colombia* | 2010 | LAC | Upper middle | 17 443 | 8669 | 4522 | 4147 | 0.93 | (0.88–0.98) | 0.020 |
| Comoros | 2012 | Eastern & Southern Africa | Low | 3022 | 951 | 489 | 462 | 0.95 | (0.72–1.18) | 0.683 |
| Congo (Brazzaville) | 2011 | West & Central Africa | Lower middle | 8857 | 3398 | 1733 | 1665 | 0.93 | (0.82–1.04) | 0.257 |
| Congo D.R. | 2013 | West & Central Africa | Low | 17 228 | 7292 | 3657 | 3635 | 1.01 | (0.92–1.09) | 0.781 |
| Cote d’Ivoire | 2011 | West & Central Africa | Lower middle | 7093 | 2453 | 1233 | 1220 | 1.03 | (0.86–1.20) | 0.687 |
| Dominican Republic | 2013 | LAC | Upper middle | 3606 | 1412 | 724 | 688 | 1.03 | (0.91–1.15) | 0.572 |
| Egypt* | 2014 | Middle East & North Africa | Lower middle | 15 466 | 5262 | 2867 | 2395 | 0.93 | (0.89–0.97) | 0.004 |
| Ethiopia | 2011 | Eastern & Southern Africa | Low | 10 808 | 3161 | 1621 | 1540 | 1.01 | (0.85–1.17) | 0.848 |
| Gabon | 2012 | West & Central Africa | Upper middle | 5747 | 2258 | 1135 | 1123 | 0.87 | (0.72–1.02) | 0.126 |
| Gambia | 2013 | West & Central Africa | Low | 7788 | 2127 | 1112 | 1015 | 0.96 | (0.88–1.04) | 0.370 |
| Ghana | 2014 | West & Central Africa | Lower middle | 5595 | 1396 | 767 | 629 | 1.03 | (0.92–1.13) | 0.513 |
| Guinea | 2012 | West & Central Africa | Low | 6424 | 2547 | 1311 | 1236 | 0.94 | (0.83–1.05) | 0.311 |
| Guyana | 2009 | LAC | Lower middle | 2105 | 600 | 315 | 285 | 1.06 | (0.89–1.23) | 0.427 |
| Haiti* | 2012 | LAC | Low | 6744 | 3650 | 1840 | 1810 | 1.11 | (0.99–1.22) | 0.044 |
| Honduras | 2011 | LAC | Lower middle | 10 592 | 4379 | 2335 | 2044 | 1.00 | (0.93–1.06) | 0.978 |
| India* | 2005 | South Asia | Lower middle | 48 679 | 11,336 | 6089 | 5247 | 0.93 | (0.90–0.96) | 0.000 |
| Indonesia | 2012 | East Asia & Pacific | Lower middle | 17 367 | 7029 | 3787 | 3242 | 0.96 | (0.92–1.00) | 0.068 |
| Jordan | 2012 | Middle East & North Africa | Upper middle | 10 128 | 3017 | 1595 | 1422 | 0.97 | (0.88–1.07) | 0.649 |
| Kenya | 2014 | Eastern & Southern Africa | Low | 20 093 | 7690 | 3922 | 3768 | 0.98 | (0.94–1.03) | 0.601 |
| Kyrgyzstan | 2012 | CEE & CIS | Low | 4247 | 392 | 200 | 192 | 0.88 | (0.66–1.10) | 0.320 |
| Lesotho | 2009 | Eastern & Southern Africa | Lower middle | 3606 | 1033 | 505 | 528 | 1.00 | (0.89–1.12) | 0.872 |
| Liberia* | 2013 | West & Central Africa | Low | 7058 | 3219 | 1659 | 1560 | 0.91 | (0.83–0.98) | 0.029 |
| Madagascar | 2008 | Eastern & Southern Africa | Low | 11 750 | 2029 | 1027 | 1002 | 0.92 | (0.80–1.04) | 0.244 |
| Malawi | 2010 | Eastern & Southern Africa | Low | 18 360 | 8227 | 4174 | 4053 | 0.99 | (0.95–1.02) | 0.634 |
| Maldives | 2009 | South Asia | Upper middle | 3761 | 1353 | 689 | 664 | 1.03 | (0.96–1.09) | 0.350 |
| Mali | 2012 | West & Central Africa | Low | 9582 | 1619 | 870 | 749 | 1.01 | (0.83–1.19) | 0.861 |
| Moldova | 2005 | CEE & CIS | Lower middle | 1533 | 368 | 172 | 196 | 0.96 | (0.75–1.17) | 0.723 |
| Mozambique | 2011 | Eastern & Southern Africa | Low | 10 291 | 2224 | 1131 | 1093 | 1.02 | (0.93–1.10) | 0.622 |
| Namibia | 2013 | Eastern & Southern Africa | Upper middle | 4818 | 1699 | 855 | 844 | 0.94 | (0.86–1.03) | 0.260 |
| Nepal | 2011 | South Asia | Low | 5054 | 1416 | 793 | 623 | 0.88 | (0.75–1.01) | 0.085 |
| Niger | 2012 | West & Central Africa | Low | 11 602 | 2852 | 1418 | 1434 | 0.93 | (0.85–1.02) | 0.165 |
| Nigeria | 2013 | West & Central Africa | Lower middle | 28 596 | 5787 | 2965 | 2822 | 1.00 | (0.91–1.09) | 0.897 |
| Pakistan | 2012 | South Asia | Lower middle | 10 935 | 5213 | 2750 | 2463 | 0.96 | (0.93–1.00) | 0.095 |
| Peru | 2012 | LAC | Upper middle | 9445 | 3134 | 1617 | 1517 | 1.02 | (0.93–1.12) | 0.543 |
| Philippines | 2013 | East Asia & Pacific | Lower middle | 7012 | 2413 | 1263 | 1150 | 1.01 | (0.93–1.09) | 0.707 |
| Rwanda | 2014 | Eastern & Southern Africa | Low | 7558 | 2190 | 1105 | 1085 | 0.99 | (0.89–1.08) | 0.903 |
| Sao Tome and Principe | 2008 | West & Central Africa | Lower middle | 1851 | 504 | 269 | 235 | 1.08 | (0.90–1.26) | 0.329 |
| Senegal* | 2014 | West & Central Africa | Lower middle | 6526 | 1633 | 865 | 768 | 0.76 | (0.65–0.87) | 0.000 |
| Sierra Leone | 2013 | West & Central Africa | Low | 10 618 | 3602 | 1797 | 1805 | 0.97 | (0.91–1.02) | 0.338 |
| Swaziland | 2006 | Eastern & Southern Africa | Lower middle | 2537 | 946 | 524 | 422 | 1.03 | (0.90–1.16) | 0.563 |
| Tajikistan | 2012 | CEE & CIS | Low | 4838 | 922 | 511 | 411 | 1.08 | (0.93–1.22) | 0.265 |
| Tanzania | 2010 | Eastern & Southern Africa | Low | 7526 | 2290 | 1163 | 1127 | 1.04 | (0.96–1.12) | 0.269 |
| Timor–Leste | 2009 | East Asia & Pacific | Lower middle | 9294 | 2661 | 1308 | 1353 | 0.98 | (0.93–1.03) | 0.473 |
| Togo | 2013 | West & Central Africa | Low | 6535 | 2262 | 1155 | 1107 | 1.07 | (0.95–1.20) | 0.221 |
| Uganda* | 2011 | Eastern & Southern Africa | Low | 7355 | 3946 | 2007 | 1939 | 1.04 | (1.01–1.08) | 0.008 |
| Yemen* | 2013 | Middle East & North Africa | Lower middle | 15 383 | 7345 | 3875 | 3470 | 0.85 | (0.78–0.92) | 0.000 |
| Zambia | 2013 | Eastern & Southern Africa | Lower middle | 12 714 | 4238 | 2139 | 2099 | 1.01 | (0.95–1.06) | 0.656 |
| Zimbabwe | 2010 | Eastern & Southern Africa | Low | 5203 | 1358 | 686 | 672 | 1.06 | (0.91–1.21) | 0.405 |
CI – confidence interval, CEE – Central and Eastern Europe, CIS – Commonwealth of Independent States, LAC – Latin America & the Caribbean
*Countries with significant sex differences in careseeking (P < 0.05).
Sex ratios for careseeking (girls/boys) ranged from 0.76 (0.68–0.85) in Senegal to 1.11 (0.99–1.24) in Haiti ( Figure 1 ). The average value for all countries was 0.97 (0.96–1.00).
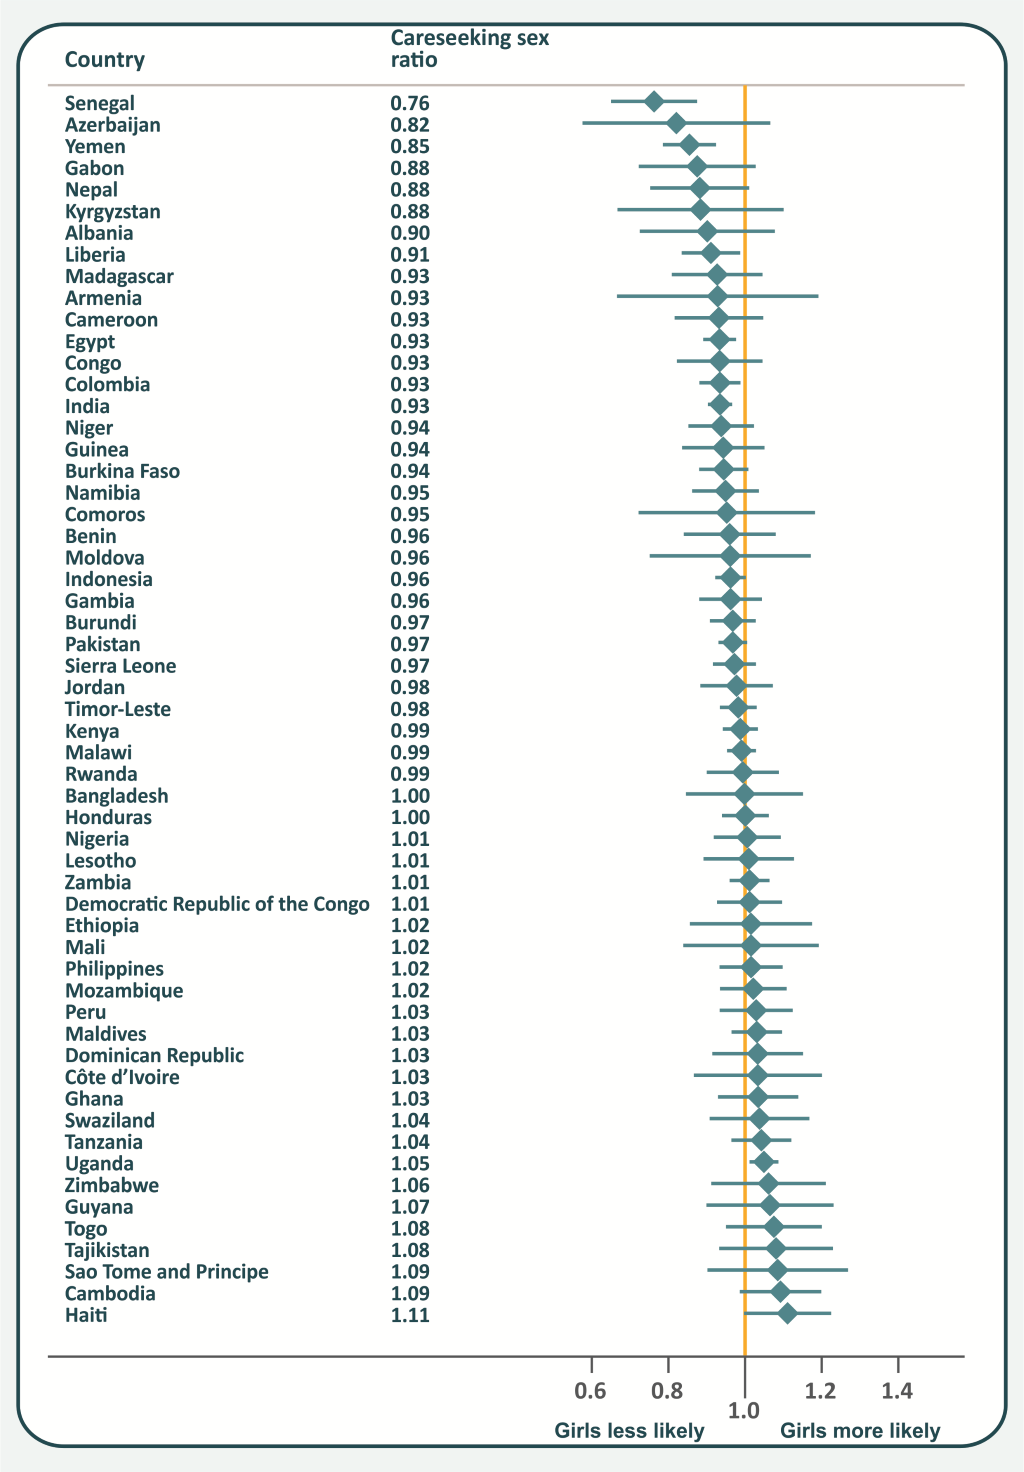
Eight countries showed statistical evidence of gender bias. In six of these (Senegal, Yemen, Liberia, Egypt, Colombia and India) girls were less likely to be taken to a provider, with sex ratios ranging from 0.76 to 0.94. In the other two countries, Haiti and Uganda (sex ratios of 1.11 and 1.05, respectively), girls were more likely to receive care. Further results at country level including 95% confidence intervals and p values are shown in Table 1 .
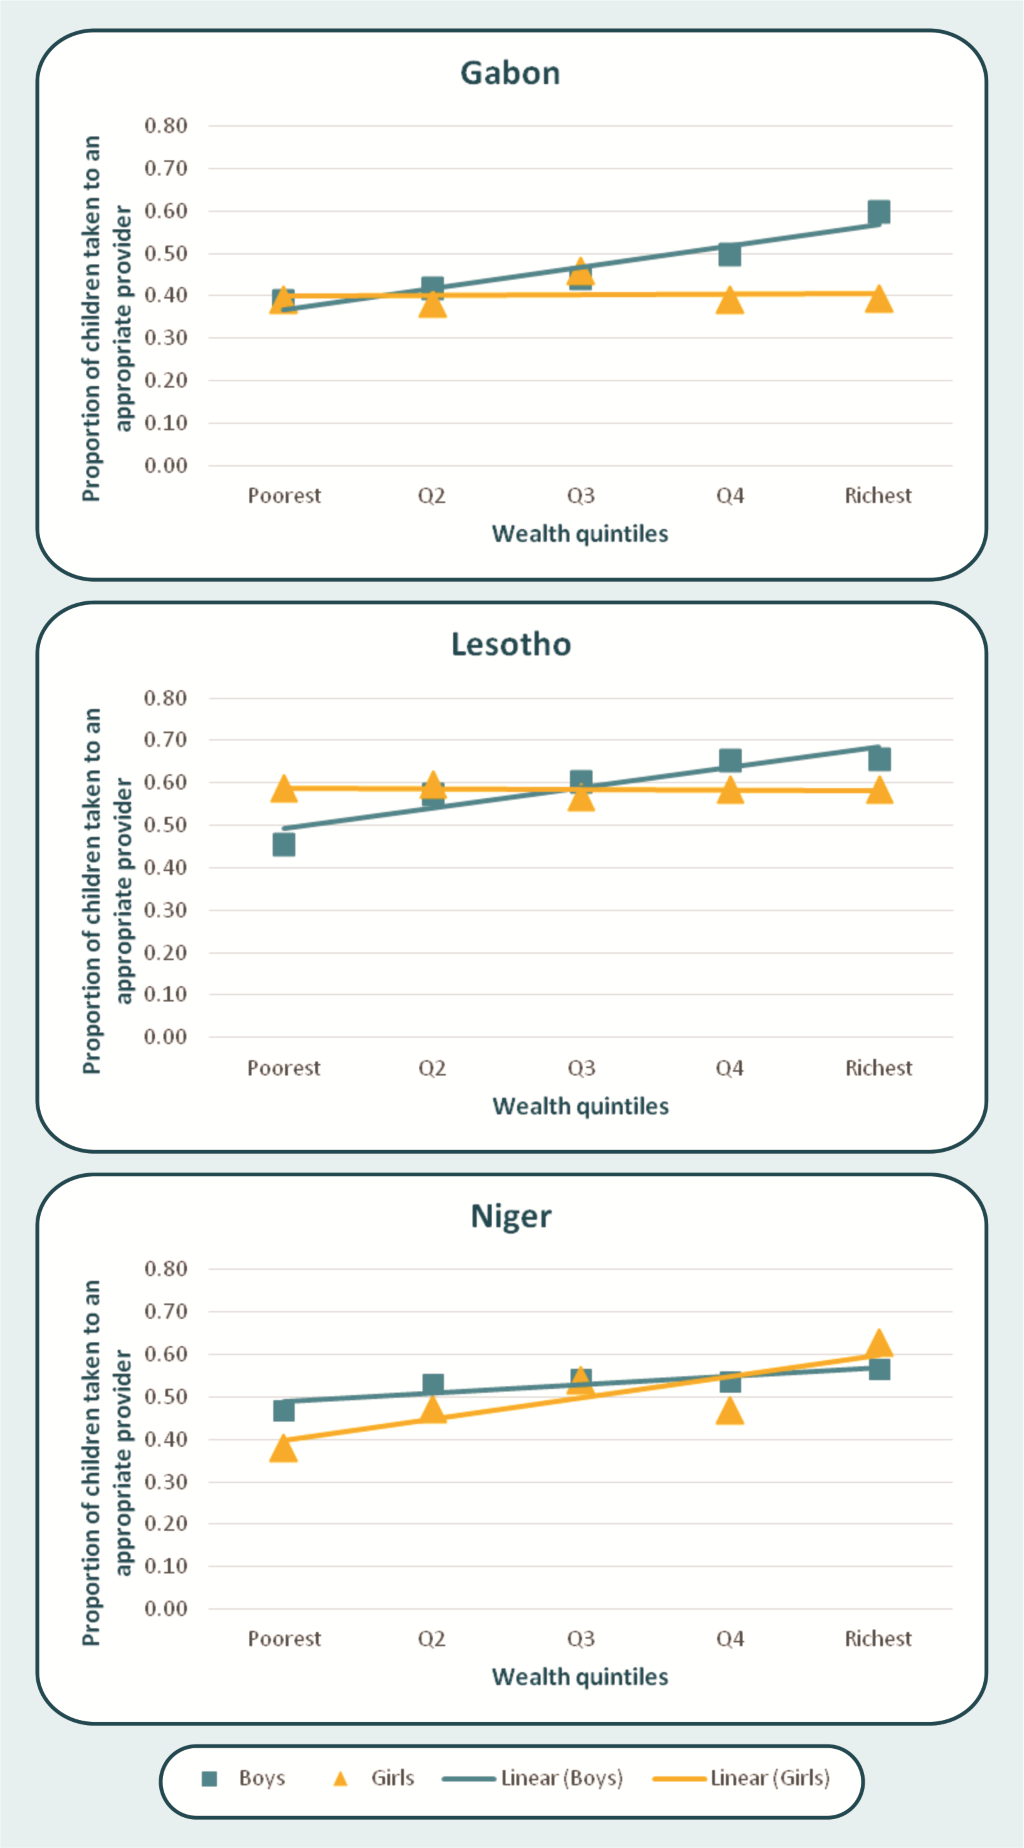
We also examined interactions between wealth and sex in careseeking coverage. Of the 57 countries, significant interactions (P < 0.05) were found in three. In Gabon and Lesotho, higher socioeconomic position was associated with greater careseeking for boys but not for girls; in Niger, the trend was in the opposite direction ( Figure 2 ). Another four countries had interactions with p levels between 0.05 and 0.1: Burkina Faso, Congo Brazzaville, Dominican Republic and Senegal. Figure S1 in Online Supplementary Document(Online Supplementary Document) shows that interaction patterns were also inconsistent in these countries.
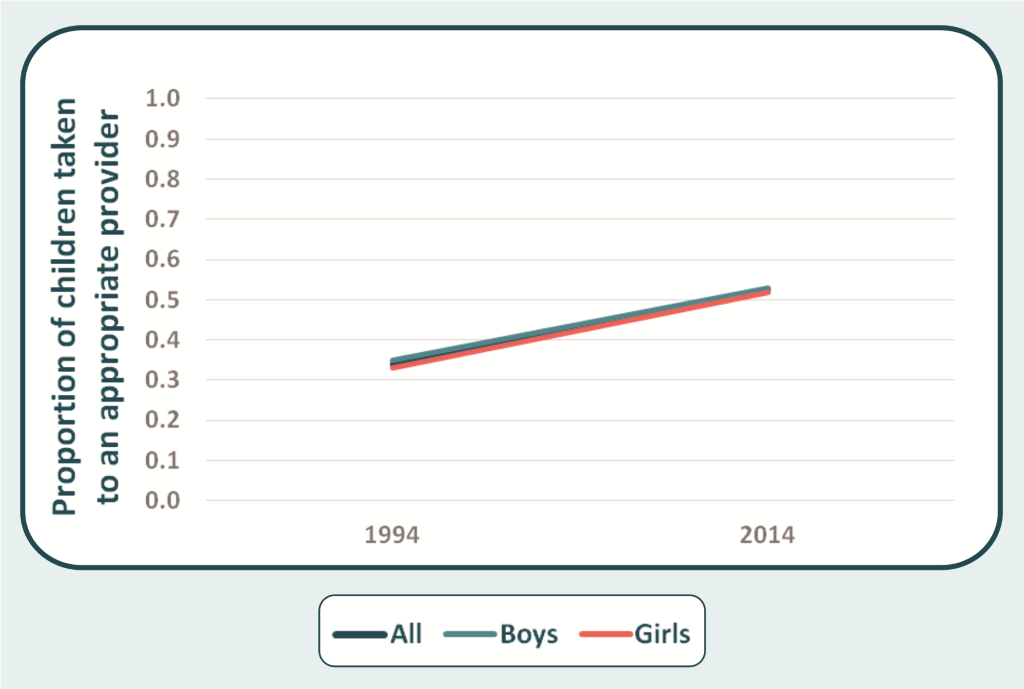
Time trends analysis showed that global careseeking coverage increased by 0.93 percent point (pp) a year between 1994 and 2014 (from 33.9% to 52.4%) ( Figure 3 ). Coverage increased for both sexes (P < 0.001): among girls the increase was 0.95 pp a year (32.9% to 51.9%), and among boys, 0.91 pp (34.8% to 52.9%).
Ecological analyses showed a lack of association between the careseeking sex ratio and most explanatory variables ( Table 2 and Table 3 ). There was no evidence of difference between the world regions. However, it should be noted that there are few surveys available for countries in South Asia and in Middle East & North Africa; most surveys are from countries in Eastern & Southern Africa, and in West & Central Africa.
| Variables | Categories | Number of countries | Mean | Standard deviation | P–value* |
|---|---|---|---|---|---|
| World region | CEE & CIS† | 6 | 0.93 | 0.09 | |
| East Asia & Pacific | 4 | 1.01 | 0.06 | ||
| Eastern & Southern Africa | 15 | 1.00 | 0.04 | ||
| Latin America & Caribbean | 6 | 1.03 | 0.06 | 0.055 | |
| Middle East & North Africa | 3 | 0.92 | 0.06 | ||
| South Asia | 5 | 0.96 | 0.06 | ||
| West & Central Africa | 18 | 0.97 | 0.08 | ||
| Country income group | Low | 28 | 0.98 | 0.07 | |
| Lower–middle | 20 | 0.98 | 0.06 | 0.398 | |
| Upper–middle | 9 | 0.95 | 0.08 | ||
| Gender Development Index groups‡ | 1. High equality | 7 | 0.98 | 0.05 | |
| 2. Medium to high equality | 3 | 0.96 | 0.07 | ||
| 3. Medium equality | 9 | 0.98 | 0.08 | 0.995 | |
| 4. Medium to low equality | 8 | 0.98 | 0.05 | ||
| 5. Low equality | 28 | 0.98 | 0.07 | ||
| Predominant religion | Christian | 35 | 1.00 | 0.05 | |
| Muslim | 19 | 0.94 | 0.07 | 0.011 | |
| Other | 3 | 0.97 | 0.11 |
*P–value based on ANOVA.
†CEE & CIS: Central and Eastern Europe and the Commonwealth of Independent States.
‡Gender Development Index groups: Countries are divided into five groups by absolute deviation from gender parity in HDI values. Group 1: countries with high equality in HDI achievements between women and men (absolute deviation of less than 2.5%); Group 2: medium to high equality (absolute deviation of 2.5–5%); Group 3: medium equality (absolute deviation of 5–7.5%); Group 4: medium to low equality (absolute deviation of 7.5–10%); and Group 5: low equality (absolute deviation from gender parity of more than 10%) [20].
| Variables | Number of countries | Correlation (95% CI) | P–value* |
|---|---|---|---|
| GDP per capita (2012) | 57 | –0.257 (–0.485; 0.003) | 0.053 |
| GDP per capita – log (2012) | 57 | –0.190 (–0.429; 0.156) | 0.157 |
| Gini coefficient for income inequality | 46 | 0.306 (0.018; 0.547) | 0.039 |
| Gender Inequality Index (2013) | 50 | 0.074 (–0.208; 0.345) | 0.607 |
| Gender Development Index (2013) | 50 | 0.090 (–0.193; 0.359) | 0.531 |
| Global Gender Gap Index (2014) | 41 | 0.190 (–0.124; 0.470) | 0.231 |
| Muslim (% population) | 57 | –0.361 (–0.568; 0.111) | 0.006 |
| Christian (% population) | 57 | 0.305 (0.049; 0.523) | 0.021 |
CI – confidence interval
*P–value based on Pearson's correlation coefficient.
Regarding income levels, most of the countries surveyed are in the low– and lower–middle income groups, and no association was found between the level and careseeking sex ratios ( Table 2 ).
There was a negative correlation, which was not statistically significant (P = 0.053) between continuous GDP per capita and the sex ratio, but not for log GDP per capita (P = 0.157).
None of the gender inequality indices were associated with the careseeking sex ratio ( Table 2 and Table 3 ). The Gender Development Index was tested both as a categorical variable, as recommended by its developers, and as a continuous index.
The religion variables were expressed both as categories of the predominant religion in each country ( Table 2 ) and as the percent of Christians and Muslims in the population ( Table 3 ). In both sets of ecological analyses, Christian religion was associated with improved care for girls, and Muslim religion with preferential careseeking for boys. These associations remained virtually unchanged after adjustment of the religion variables by GDP per capita (partial correlation coefficients of –0.351 for percent Muslim and –0.307 for percent Christian). Figure S2 in Online Supplementary Document(Online Supplementary Document) shows the careseeking sex ratios and 95% confidence intervals, for countries ranked according to the percentage of Muslim population.
We opted not to carry out extensive multivariable analyses because several explanatory variables are highly collinear (eg, GDI and income per capita, etc.) and because the gender indices also included socioeconomic variables in their construction.
The analysis of the Demographic and Health Surveys, conducted in low– and middle–income countries, explored the magnitude of gender bias against girls, investigating whether families would be less likely to seek care from appropriate providers for girls with symptoms of fever, diarrhea or pneumonia, compared to boys. We expand upon the existing literature on this topic by calculating a new composite careseeking index encompassing three conditions – diarrhea, fever and suspected pneumonia – and therefore increasing the statistical power relative to earlier analyses in which each condition was treated separately.
We found evidence of gender bias in a limited number of countries. In contrast to the pervasive socioeconomic inequalities in careseeking and coverage, gender inequalities in careseeking are modest or even absent in most countries.
A systematic review explored studies on the recognition of signs and symptoms of, and/or careseeking for pneumonia, diarrhea or malaria in low– and middle–income countries. The authors identified seven publications that evaluated careseeking by sex; four which did not find significant differences between girls and boys, two reporting higher prevalence of careseeking for boys (in Burkina Faso and Indonesia), and one showing higher careseeking for girls, but only for malaria episodes [21]. The mixed results from this review are consistent with our analyses, which do not show a clear pattern of gender bias throughout the world.
At regional levels, we did not identify evidence of gender bias; however, in six countries careseeking was significantly higher for boys, and in two for girls. At the 5% P level, one would expect 1–2 significant pro–boy differences, and another 1–2 pro–girl differences, simply due to chance. We sought interactions between sex and wealth quintiles in careseeking for all 57 countries, but only detected significant interactions (with P < 0.10) in seven countries, which could have arisen by chance. In addition, interaction patterns were not consistent, sometimes with greater gender gaps in the wealthy, and for other countries with greater gaps among the poor.
The use of a composite careseeking indicator for three common conditions, using data from nationally representative surveys avoid small denominators – a frequent problem in analyses of careseeking – and thus increases statistical power [9]. Nevertheless, in our analyses sample size varied widely between surveys, and countries with the largest surveys such as India, results can be statistically significant even when absolute differences are small.
When comparing our results with the UNICEF analyses on careseeking for separate conditions, we found that three of the six countries we identified as presenting gender bias in the combined careseeking indicator had also been identified as such by UNICEF: Yemen (fever), Egypt (suspected pneumonia) and India (suspected pneumonia and diarrhea) [7]. It is important to highlight that the UNICEF report includes some unofficial health care providers that we did not include (such as shops and traditional practitioners), and that the year of the surveys may not be the same.
We used ecological analyses in an attempt to identify national characteristics associated with gender bias. Surprisingly, we did not detect correlations between careseeking sex ratios and gender inequality indices. A recent study reported a positive association between the Gender Inequality Index with under–five mortality rate for both sexes combined; this association remained after adjustment for GDP per capita, but separate associations with mortality rates for boys and girls were not investigated [22]. The authors speculate that if gender inequality is linked to maternal health, then mortality of boys and girls would be equally affected.
National levels of wealth were not associated with gender bias in careseeking, but bias was more likely in countries with unequal income distributions. We also found that religion was a cultural characteristic that explained part of the variability, with improved careseeking for boys in countries with a higher Muslim population. More research is needed to better understand the effects of religion and culture on careseeking, including whether the ecological association we report here is also found at individual level analyses within a given country, or whether it is due to an ecological fallacy.
Other limitations in the data should be recognized. Differences in careseeking could be due to increased severity of infectious diseases among boys [7], but our results showing similar careseeking rates in most countries suggest that this did not bias the results. Also, information on the incidence of illness and on careseeking patterns is based on maternal recall, which may or may not vary systematically according to child’s sex [21].
In addition, a composite index for careseeking does not reflect how different illnesses may be perceived along the spectrum of severity; more detailed analyses might consider only severe cases (such as bloody diarrhea, for example) but this would further reduce the denominator and analyses would only be possible for very large sample sizes.
Lastly, our analyses are limited to the most recent survey per country, so that results on time trends must be interpreted with caution as for some countries the most recent publicly available survey was carried out a decade or more ago, as is the case for India.
Our results suggest that, with a few exceptions, the overall frequency of careseeking for common health conditions is similar for boys and girls in most, but not in all countries. Similar results are available for under–five mortality [4,7,23]. Countries where there is evidence of gender bias in careseeking need renewed attention of national and international initiatives, in order to ensure that girls receive adequate care and protection. In addition, more research is needed to understand the reasons behind the different treatment for girls and boys in these circumstances, including a mixture of qualitative and quantitative methods.


