“Civil registration and vital statistics don’t quicken everyone’s pulse.” So wrote Richard Horton [1] in summarising the first Global Summit on Civil Registration and Vital Statistics (CRVS), held in Bangkok in April 2013. But, as was clear from that meeting, global understanding of public health depends on having an adequately comprehensive overview of cause–specific mortality patterns at the population level. Counting people and their life events is a big part of what needs to be done more effectively and comprehensively [2]; added to that is the need to attribute cause to deaths in a systematic, rapid, consistent and cost–effective way.
Unsatisfactory progress in CRVS over recent decades lay at the heart of the four major objectives of the WHO Commission on Information and Accountability for Women’s and Children’s Health (COIA) [3]. Accountability at every level ultimately depends on effectively counting individuals, and then making good use of those data. Implementation of COIA’s recommendations was entrusted to an independent Evidence Review Group (iERG), which, in its 2013 report [4], acknowledged that COIA’s recommendation on enhancing CRVS will be “difficult or impossible to achieve” by the target date of 2015. Instead, iERG now recommends making effective CRVS a post–2015 development target. While there are evidently many practical obstacles to achieving reliable CRVS on a global scale, one prerequisite component is the availability of fit–for–purpose tools for registering deaths and assigning cause of death. Such tools must be openly accessible, and be capable of delivering consistent and systematic mortality data in a timely and cost–effective manner.
Verbal autopsy (VA; interviewing a care–giver, relative or witness after a death, and using the interview material to determine cause of death) is seen as an essential interim approach for filling in some of the gaps in global knowledge on cause–specific mortality [5], which can otherwise only be estimated [6]. Although, in the long–term, one might hope for universal physician certification of deaths, undertaken methodically and rigorously, this will not be the case for most deaths in Africa and Asia for the foreseeable future. The immediate public health concern therefore is to establish VA methods for determining cause of death which are readily applicable on a large scale (including in routine CRVS processes) and provide sufficient detail for effective health planning.
Verbal autopsy interview material has been collected in a variety of ways, and then interpreted into cause of death data by various methods. There has therefore been substantial methodological heterogeneity involved, which can magnify existing uncertainties over cause–specific mortality. The World Health Organization (WHO) released a new standard for VA data collection together with a revised set of cause of death categories (with equivalence to the International Classification of Diseases version 10 [ICD–10]) in 2012 [7]. The process undertaken to streamline previous VA approaches into the new 2012 WHO VA standard is described in detail elsewhere [5].
Ways of interpreting VA data essentially fall into physician consideration of individual cases (physician–coded verbal autopsy, PCVA) or various mathematical approaches to automated processing of VA data. PCVA has been a de facto standard in many research settings, although associated details of methods and validity have not always been well established [8] other than in specific studies of hospital–based deaths. PCVA is generally considered too slow and expensive for routine CRVS implementation, apart from the disadvantage of consuming often scarce physician time. A number of approaches to automated processing have been tried over the last decade or so; the currently most widely used is the InterVA suite of models that apply Bayesian probabilistic modelling, and which have been in the public domain in various versions since 2005 (at www.interva.net) [9]. Corresponding to the release of the 2012 WHO VA standard, InterVA–4 was released in 2012, incorporating exactly the same range of input and output parameters as specified by WHO [10].
Nevertheless, monitoring cause–specific mortality is a long–term process, and so much of the existing VA material which is archived in various places reflects earlier standards and variations. It will be some time yet before any substantial body of VA data originally collected according to the provisions of the 2012 WHO VA standard becomes available. Our aim in this paper is to take VA archives from a variety of pre–2012 sources, which have also been assessed by PCVA, convert them insofar as is possible into the 2012 WHO format, and compare the PCVA and InterVA–4 findings. Our objective is primarily methodological. Rather than attempting to illuminate specific epidemiological findings, we evaluate the consistency between applying the 2012 WHO VA standard and the corresponding InterVA–4 model to existing secondary data, and compare this with the primary physician–coded findings from the same data. The underlying consideration is the public health consistency and relevance of the two approaches – InterVA–4 and PCVA – as a source of information for health planning in regions where routine cause–specific mortality data are scarce. Many national and regional public health practitioners are posing the question as to whether they can reasonably rely on verbal autopsy surveillance with automated methods for assigning cause of death to monitor mortality patterns in the populations they serve: this study aims to answer that question.
For the purposes of this comparison, we have selected several VA data sets for secondary analyses on grounds of availability, variety of original VA procedures, coverage of diverse geographic locations and population groups, and with well–established local PCVA procedures. PCVA procedures varied slightly between sites, but for every site the consensus “main” or “underlying” cause was used here. The sources and characteristics of the data are shown in Table 1 . Data were sourced from Afghanistan, Bangladesh, Ghana, Kenya and South Africa. The original sources were of two main types, Demographic and Household Surveys (DHS) [17] and INDEPTH Network Health and Demographic Surveillance Systems (HDSS) [18] but there were also local variations in the details of VA procedures used within these two groupings. The locations also cover a wide range of HIV and malaria prevalences, which are the two causes of death which vary most markedly geographically. The two sites in South Africa are only 600 km apart and share a number of characteristics, but used different VA procedures. All of the PCVA results were reported using ICD–10 codes, enabling direct comparison with the InterVA–4 outputs using the WHO 2012 ICD–10 cause category definitions.
| Source | Type of data | Location | Population group | Period deaths occurred | Verbal autopsy instrument | Deaths covered | Reference |
|---|---|---|---|---|---|---|---|
| Afghanistan | DHS | National cluster sample survey | Entire | 2005–2010 | DDHS form | 3349 | [11] |
| Bangladesh | DHS | National cluster sample survey | Women aged 12 to 49 y | 1997–2001 | DHS form | 928 | [12] |
| Ghana | DHS | National cluster sample survey | Women aged 12 to 49 y | 2002–2007 | DHS form | 4203 | [13] |
| Kenya | INDEPTH HDSS | Surveillance site in Siaya County | Entire | 2003–2010 | Adapted INDEPTH form | 21 236 | [14] |
| South Africa A | INDEPTH HDSS | Surveillance site in Bushbuckridge | Entire | 1992–2010 | Locally adapted form | 10 139 | [15] |
| South Africa B | INDEPTH HDSS | Surveillance site in Kwa–Zulu Natal | Entire | 2000–2011 | Adapted INDEPTH form | 14 327 | [16] |
DHS – Demographic and Health Survey, HDSS – Health and Demographic Surveillance System
Stata command files were created for each site to extract as many as possible of the 2012 WHO InterVA indicators for each case (possible indicators total 244 across all age–sex groups, with the number of applicable questions for any particular death ranging from 54 to 181) from the various VA data sets. VA records which did not contain any symptom data (ie, only identification and background indicators) or which did not include valid age and sex details were excluded. The VA data from each source were then processed using InterVA–4 (version 4.02) and the cause of death outputs processed into cause–specific mortality fractions (CSMF) as previously described [10]. PCVA outputs, specified as ICD–10 codes, were categorised into the 2012 WHO VA cause of death groups for comparative purposes, using the conversion table specified in the WHO documentation. Age–groups corresponding to WHO 2012 categories (0–28 days, 1–11 months, 1–4 years, 5–14 years, 15–49 years, 50–64 years and 65+ years) were used as the basis for analysis. Because of inherent uncertainty at the individual level in differentiating in many cases between the 01.03 HIV/AIDS and 01.09 pulmonary TB cause categories, both for InterVA–4 and PCVA, comparisons are presented with those categories separate and combined.
CSMFs were calculated for each source and cause of death, separately for InterVA–4 and PCVA findings. Concordance between InterVA–4 and PCVA CSMFs was measured using Lin’s concordance correlation coefficient [19], corrected and implemented for Stata [20]. As an alternative metric for assessing the equivalence of CSMFs from InterVA–4 and PCVA findings, we used the Wilcoxon matched–pairs signed ranks test and its two one–sided tests (TOST) variant for stochastic equivalence, with epsilon set to 3, as implemented for Stata [21]. Ratios of CSMFs according to InterVA–4 and PCVA, by source, age–sex group and cause, were calculated together with 99% CIs, according to the Katz adjusted log method which permits the estimation of intervals around ratios where one side is zero [22]. CIs were calculated at the 99% level as hundreds of separate ratios were assessed. The objective of calculating these CIs was not so much for the sake of demonstrating statistical significance, but rather to identify particular causes and age–sex groups for which the CSMF ratios between interpretations by InterVA–4 and physicians were appreciably lower or higher than might be expected by chance, taking into account the number of cases involved.
No specific ethical clearance was required for this study, which relied solely on the analysis of existing secondary data, without individually identifiable information. For the Kenya data set, in Kisumu, following cultural customs, compound heads provide written consent for all compound members to participate in the HDSS activities. Any individual can refuse to participate at any time. The Kisumu HDSS protocol and consent procedures, including surveillance and VA, were approved by KEMRI and CDC Institutional Review Boards annually. For the South Africa A data set, surveillance–based studies in the Agincourt subdistrict were reviewed and approved by the Committee for Research on Human Subjects (Medical) of the University of the Witwatersrand, Johannesburg, South Africa (protocol M960720, renewed). Informed consent was obtained at the individual and household levels at every follow–up visit, whereas community consent from civic and traditional leadership was secured at the start of surveillance and reaffirmed from time to time. For the South Africa B data set, ethical approval for the Africa Centre Demographic Surveillance was provided by the University of Kwa–Zulu–Natal Bio–Medical Research Ethics Committee (protocol E009/00).
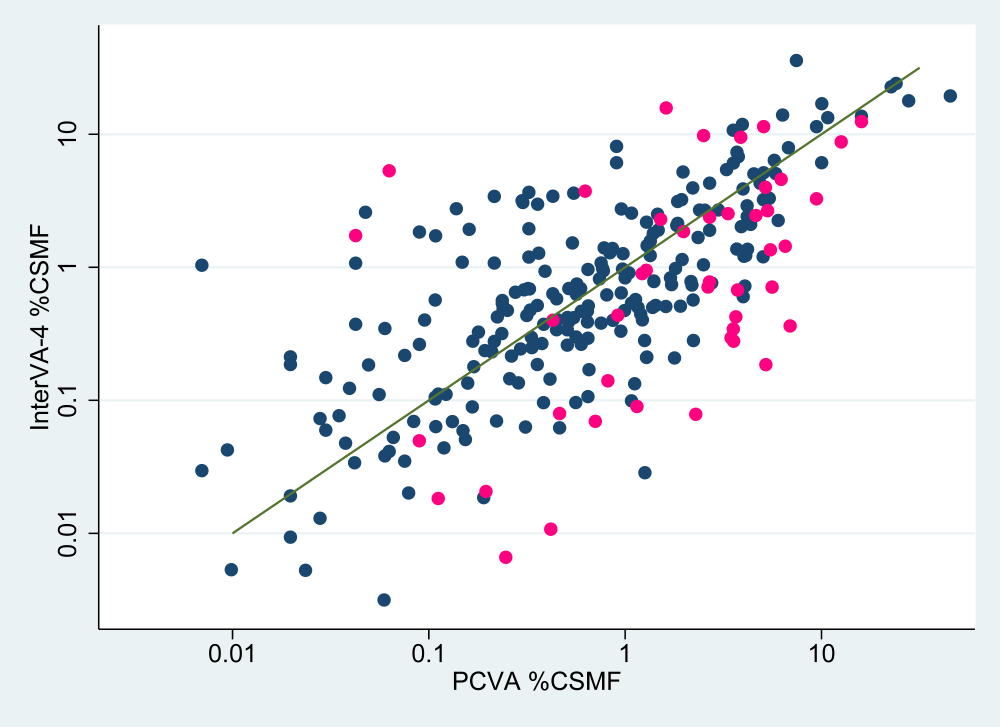
Over the total of 54 182 VA records analysed, Table 2 shows concordance correlation coefficients by data source and by age–group, both for the basic outputs and with the HIV and TB categories combined for sub–Saharan Africa. Figure 1 shows, for each WHO 2012 cause category and over all the six sources, a scatter plot of CSMFs from both InterVA–4 and PCVA interpretations. The corresponding concordance correlation coefficient was 0.831 (95% CI 0.751–0.911), and this increased to 0.974 (95% CI 0.961–0.987) when the 01.03 HIV/AIDS and 01.09 pulmonary TB cause categories were combined for sub–Saharan Africa. Table 3 shows results from the alternative Wilcoxon’s metric for equivalence between CSMFs. Equivalence is represented by the large p values for the standard Wilcoxon’s signed rank test (not permitting rejection of the null hypothesis of no difference) together with significant p values indicating that differences lay within the equivalence range.
| Deaths | Basic data | HIV/AIDS and pulmonary TB categories combined | |||
|---|---|---|---|---|---|
| CCC | 95% CI | CCC | 95% CI | ||
| Overall | 54 182 | 0.831 | 0.751–0.911 | 0.974 | 0.961–0.987 |
| Source: | |||||
| Afghanistan | 3349 | 0.625 | 0.464–0.787 | – | – |
| Bangladesh | 928 | 0.720 | 0.580–0.860 | – | – |
| Ghana | 4203 | 0.665 | 0.509–0.821 | 0.751 | 0.631–0.871 |
| Kenya | 21 236 | 0.854 | 0.785–0.923 | 0.923 | 0.885–0.960 |
| South Africa A | 10 139 | 0.912 | 0.868–0.956 | 0.947 | 0.922–0.972 |
| South Africa B | 14 327 | 0.588 | 0.415–0.760 | 0.990 | 0.985–0.995 |
| Age–group: | |||||
| 0–28 d | 1678 | 0.529 | 0.258–0.801 | 0.529 | 0.258–0.801 |
| 1–11 mo | 5070 | 0.813 | 0.722–0.904 | 0.810 | 0.713–0.908 |
| 1–4 y | 5123 | 0.886 | 0.824–0.948 | 0.909 | 0.857–0.961 |
| 5–14 y | 1734 | 0.828 | 0.733–0.922 | 0.888 | 0.826–0.949 |
| 15–49 y | 24 478 | 0.771 | 0.663–0.880 | 0.991 | 0.986–0.996 |
| 50–64 y | 6239 | 0.784 | 0.667–0.902 | 0.981 | 0.969–0.993 |
| 65+ years | 9860 | 0.846 | 0.760–0.931 | 0.895 | 0.835–0.956 |
CI – confidence interval, TB - tuberculosis
| Source | Wilcoxon matched pairs signed ranks (P) | Two one–sided tests variant for stochastic equivalence (ϵ = 3) plow, phigh |
|---|---|---|
| Overall | 0.187 | 0.001, 0.047 |
| Afghanistan | 0.808 | 0.001, 0.003 |
| Bangladesh | 0.870 | 0.002, 0.001 |
| Ghana | 0.358 | 0.001, 0.007 |
| Kenya | 0.607 | 0.001, 0.007 |
| South Africa A | 0.262 | 0.001, 0.030 |
| South Africa B | 0.509 | 0.001, 0.010 |
Graphical presentations for each source separately, in a similar format to Figure 1 , are available in Online Supplementary Document, which also show WHO 2012 cause categories. Table 4 shows the CSMF for each WHO 2012 cause category and site, as determined by InterVA–4 and PCVA.
| Cause of death | Data source | |||||||||||
|---|---|---|---|---|---|---|---|---|---|---|---|---|
| Afghanistan (3349 deaths) | Bangladesh (928 deaths) | Ghana (4203 deaths) | Kenya (21 236 deaths) | South Africa A (10 139 deaths) | South Africa B (14 327 deaths) | |||||||
| InterVA–4* | PCVA | InterVA–4 | PCVA | InterVA–4 | PCVA | InterVA–4 | PCVA | InterVA–4 | PCVA | InterVA–4 | PCVA | |
| 01.01 Sepsis (non–obstetric) | 0.26 | 0.09 | 0.01 | 0.24 | 0.19 | 0.19 | 0.02 | 0.02 | ||||
| 01.02 Acute resp. infect, incl. pneumonia | 11.41 | 9.44 | 3.41 | 0.22 | 0.74 | 2.19 | 13.95 | 6.34 | 11.86 | 3.96 | 6.37 | 5.75 |
| 01.03 HIV/AIDS related death | 0.89 | 0.12 | 22.73 | 22.65 | 17.85 | 27.82 | 24.09 | 24.01 | 19.41 | 45.33 | ||
| 01.04 Diarrhoeal diseases | 5.06 | 5.85 | 1.37 | 4.20 | 1.20 | 5.04 | 2.41 | 4.19 | 2.02 | 3.91 | 0.57 | 2.22 |
| 01.05 Malaria | 0.40 | 1.22 | 0.96 | 0.65 | 2.25 | 6.02 | 13.66 | 15.98 | 0.50 | 1.38 | 0.42 | 0.22 |
| 01.06 Measles | 0.72 | 0.69 | 0.32 | 0.07 | 0.05 | |||||||
| 01.07 Meningitis and encephalitis | 2.51 | 1.46 | 1.52 | 0.54 | 3.55 | 0.76 | 2.76 | 0.51 | 1.91 | 1.04 | 2.51 | |
| 01.08, 10.05 Tetanus | 0.01 | 0.02 | 0.01 | |||||||||
| 01.09 Pulmonary tuberculosis | 10.73 | 3.55 | 6.79 | 3.77 | 7.34 | 3.71 | 13.33 | 10.76 | 16.98 | 10.04 | 35.85 | 7.45 |
| 01.10 Pertussis | 0.13 | 0.03 | 0.26 | 0.03 | ||||||||
| 01.11 Haemorrhagic fever | 0.06 | 0.01 | 0.01 | 0.01 | ||||||||
| 01.99 Other and unspecified infect dis | 1.35 | 5.49 | 0.34 | 3.56 | 0.19 | 5.21 | 0.95 | 1.28 | 0.68 | 3.74 | 0.14 | 0.82 |
| 02.01 Oral neoplasms | 0.35 | 0.06 | 1.19 | 0.32 | 0.46 | 0.00 | 0.14 | 0.21 | 0.02 | 0.11 | 0.06 | |
| 02.02 Digestive neoplasms | 2.90 | 4.18 | 6.07 | 3.56 | 3.42 | 0.43 | 1.90 | 1.47 | 2.75 | 0.96 | 1.40 | 0.78 |
| 02.03 Respiratory neoplasms | 1.84 | 0.09 | 1.95 | 0.32 | 2.59 | 0.05 | 1.72 | 0.11 | 0.56 | 0.24 | 1.93 | 0.16 |
| 02.04 Breast neoplasms | 0.47 | 0.60 | 2.55 | 1.08 | 2.18 | 1.28 | 0.07 | 0.22 | 0.68 | 0.31 | 0.23 | 0.21 |
| 02.05, 02.06 Reproductive neoplasms M,F | 0.49 | 0.24 | 4.29 | 2.69 | 3.61 | 0.55 | 0.33 | 0.95 | 0.98 | 1.80 | 0.98 | 0.77 |
| 02.99 Other and unspecified neoplasms | 2.53 | 3.34 | 2.45 | 4.63 | 0.28 | 3.57 | 2.29 | 1.52 | 1.85 | 1.98 | 0.90 | 1.22 |
| 03.01 Severe anaemia | 0.78 | 1.08 | 0.22 | 0.05 | 0.28 | 2.23 | 0.09 | 0.24 | ||||
| 03.02 Severe malnutrition | 3.95 | 2.21 | 0.68 | 0.04 | 0.72 | 4.07 | 0.50 | 1.16 | 0.39 | 0.52 | ||
| 03.03 Diabetes mellitus | 1.21 | 4.03 | 1.39 | 0.86 | 0.13 | 1.12 | 0.57 | 1.13 | 1.80 | 1.39 | 1.68 | 2.35 |
| 04.01 Acute cardiac disease | 0.83 | 1.70 | 1.90 | 2.69 | 0.47 | 0.64 | 0.37 | 0.04 | 0.43 | 0.32 | 0.44 | 1.20 |
| 04.03 Sickle cell with crisis | 0.18 | 0.27 | 0.38 | |||||||||
| 04.02 Stroke | 4.28 | 4.87 | 7.92 | 6.79 | 1.23 | 4.12 | 1.23 | 1.34 | 2.10 | 4.36 | 3.30 | 5.42 |
| 04.99 Other and unspecified cardiac dis. | 3.27 | 9.44 | 9.49 | 3.88 | 4.58 | 6.23 | 3.74 | 0.63 | 2.66 | 5.32 | 3.99 | 5.19 |
| 05.01 Chronic obstructive pulmonary dis. | 1.58 | 1.34 | 0.10 | 0.11 | 0.24 | 0.00 | 0.60 | 3.99 | 2.76 | 0.14 | 1.28 | 0.36 |
| 05.02 Asthma | 1.29 | 0.84 | 0.78 | 1.40 | 6.11 | 0.90 | 0.34 | 0.45 | 0.69 | 0.33 | 0.69 | 0.52 |
| 06.01 Acute abdomen | 2.98 | 0.36 | 3.66 | 0.32 | 8.12 | 0.90 | 3.07 | 0.30 | 1.09 | 0.15 | 1.04 | 0.01 |
| 06.02 Liver cirrhosis | 0.75 | 0.57 | 3.88 | 3.99 | 0.78 | 2.17 | 0.63 | 0.57 | 0.52 | 1.43 | 0.28 | 1.26 |
| 07.01 Renal failure | 0.26 | 0.51 | 3.23 | 1.94 | 1.27 | 0.98 | 0.47 | 0.99 | 0.14 | 0.41 | 0.51 | 0.65 |
| 08.01 Epilepsy | 0.40 | 0.87 | 1.46 | 1.29 | 0.03 | 1.26 | 0.17 | 0.65 | 0.30 | 0.56 | 0.40 | 0.45 |
| 98 Other and unspecified NCD | 0.78 | 2.69 | 2.38 | 2.69 | 0.36 | 6.92 | 1.73 | 0.04 | 0.71 | 2.64 | 0.08 | 2.29 |
| 10.06 Congenital malformation | 0.51 | 1.61 | 0.11 | 0.07 | 0.13 | 0.06 | 0.46 | 0.15 | 0.26 | |||
| 10.01 Prematurity | 2.14 | 1.85 | 0.10 | 0.56 | 0.82 | 0.74 | 0.10 | 0.38 | ||||
| 10.02 Birth asphyxia | 3.17 | 0.30 | 0.93 | 0.39 | 0.53 | 0.24 | 0.24 | 0.29 | ||||
| 10.03 Neonatal pneumonia | 5.21 | 1.97 | 1.07 | 0.04 | 0.65 | 0.28 | 0.47 | 0.25 | ||||
| 10.04 Neonatal sepsis | 1.37 | 3.70 | 0.21 | 1.29 | 0.12 | 0.04 | 0.07 | 0.03 | ||||
| 10.99 Other and unspecified neonatal CoD | 1.44 | 6.54 | 0.40 | 0.43 | 0.08 | 0.46 | 0.02 | 0.11 | ||||
| 12.01 Road traffic accident | 2.70 | 2.99 | 0.28 | 0.22 | 2.06 | 1.83 | 0.42 | 0.51 | 2.43 | 2.69 | 2.69 | 2.39 |
| 12.02 Other transport accident | 0.06 | 0.02 | 0.01 | 0.70 | ||||||||
| 12.03 Accid. fall | 0.64 | 0.96 | 0.11 | 0.42 | 0.55 | 0.22 | 0.08 | 0.10 | 0.04 | 0.06 | ||
| 12.04 Accid. drowning and submersion | 0.62 | 0.81 | 0.11 | 0.65 | 0.30 | 0.33 | 0.33 | 0.18 | 0.14 | 0.29 | 0.25 | 0.34 |
| 12.05 Accid. expos to smoke, fire & flame | 0.26 | 0.60 | 0.29 | 0.65 | 0.09 | 0.17 | 0.22 | 0.26 | 0.37 | 0.38 | 0.28 | 0.17 |
| 12.06 Contact with venomous plant/animal | 0.34 | 0.51 | 0.97 | 0.97 | 0.40 | 0.52 | 0.11 | 0.12 | 0.09 | 0.08 | 0.03 | |
| 12.10 Exposure to force of nature | 0.06 | 0.32 | 0.12 | 0.04 | 0.01 | 0.15 | 0.03 | |||||
| 12.07 Accid. poisoning and noxious subs | 0.04 | 0.12 | 0.03 | 0.02 | 0.19 | 0.06 | 0.31 | 0.13 | 0.16 | 0.05 | 0.15 | |
| 12.08 Intentional self–harm | 0.48 | 0.33 | 6.12 | 10.02 | 0.40 | 0.10 | 0.32 | 0.24 | 0.79 | 1.40 | 0.94 | 0.77 |
| 12.09 Assault | 3.13 | 1.85 | 0.38 | 0.75 | 0.52 | 0.36 | 0.69 | 0.59 | 2.69 | 2.54 | 5.14 | 5.07 |
| 12.99 Other and unspecified external CoD | 0.29 | 3.46 | 1.83 | 0.31 | 0.09 | 1.15 | 0.44 | 0.92 | 0.07 | 0.70 | ||
| 09.01 Ectopic pregnancy | 0.11 | 0.11 | 0.63 | 0.43 | 0.01 | 0.01 | 0.02 | 0.03 | 0.01 | |||
| 09.02 Abortion–related death | 0.06 | 0.03 | 0.54 | 1.08 | 1.14 | 1.95 | 0.03 | 0.08 | 0.06 | 0.01 | 0.03 | |
| 09.03 Pregnancy–induced hypertension | 0.58 | 0.45 | 5.04 | 4.53 | 0.21 | 1.28 | 0.05 | 0.04 | 0.06 | 0.11 | 0.11 | 0.11 |
| 09.04 Obstetric haemorrhage | 0.91 | 1.05 | 3.23 | 5.06 | 5.43 | 3.28 | 0.18 | 0.17 | 0.18 | 0.05 | 0.07 | 0.08 |
| 09.05 Obstructed labour | 0.06 | 0.15 | 0.10 | 1.08 | 0.39 | 0.64 | ||||||
| 09.06 Pregnancy–related sepsis | 0.15 | 0.03 | 1.08 | 0.75 | 0.83 | 1.00 | 0.05 | 0.07 | 0.02 | 0.08 | 0.03 | 0.04 |
| 09.07 Anaemia of pregnancy | 0.04 | 0.06 | 0.74 | 1.72 | 0.21 | 1.78 | 0.04 | 0.02 | 0.02 | 0.03 | ||
| 09.08 Ruptured uterus | 0.57 | 0.11 | 0.19 | 0.36 | 0.01 | 0.01 | ||||||
| 09.99 Other and unspecified maternal CoD | 0.01 | 0.42 | 0.71 | 5.60 | 0.42 | 3.66 | 0.05 | 0.09 | 0.01 | 0.25 | 0.02 | 0.20 |
| 99 Indeterminate | 11.41 | 5.08 | 8.76 | 12.61 | 15.77 | 1.62 | 9.77 | 2.51 | 12.45 | 15.99 | 5.32 | 0.06 |
| Overall | 100.00 | 100.00 | 100.00 | 100.00 | 100.00 | 100.00 | 100.00 | 100.00 | 100.00 | 100.00 | 100.00 | 100.00 |
VA – verbal autopsy, PCVA – physician–coded verbal autopsy, M – male, F – female, CoD – cause of death
*InterVA–4 software [10].
Using the CSMFs shown in Table 3 for each cause and source, CSMF ratios InterVA–4:PCVA were calculated with 99% confidence intervals as a basis for comparison. These are tabulated fully in Additional File 1. Of the 320 source/cause comparisons that were made, 171 (53.4%) of these ratios were not significantly different from unity at the 99% level.
CSMFs were similarly calculated by age–group and sex, across all sources. These results, in a similar format to Table 2 , are shown in Online Supplementary Document. A further table in Online Supplementary Document shows CSMF ratios InterVA–4:PCVA, with 99% confidence intervals, for each cause and age–sex group, over all data sources. Of the 530 age–sex/cause comparisons that were made, 329 (62.1%) of these ratios were not significantly different from unity at the 99% level.
Our results show a generally good level of agreement between the InterVA–4 and PCVA approaches to the interpretation of this large VA data set, over diverse populations. There are some important differences, discussed below, but nevertheless the two approaches achieved good public health equivalence, meaning that taking public health and health planning measures on the basis of either source would lead to similar conclusions. This concept of “public health equivalence” is very important in interpreting these findings. Development of VA methods in recent years has led to a situation in which public health practitioners in countries where deaths are not routinely registered with causes are posing important practical questions. They need to know whether they can reasonably rely on modern VA methods with automated interpretation to provide policy–relevant information on mortality patterns in a cost–effective manner. This is not just a matter of identifying major causes of death – it is equally critical, for example, to monitor causes that have become rare, such as measles, in order to be sure of the continued effectiveness of vaccination programmes. Previous work [23,24] has shown that InterVA–4 can be effectively operationalised at much lower cost than PCVA; here we demonstrate its functional equivalence to PCVA.
It is critical to realise that neither InterVA–4 nor PCVA, nor indeed the underlying VA data to which they have been applied, necessarily represent absolute truth (whatever that may be) in terms of cause of death. Cause of death assignment is, at best, a mixture of science and judgement [25]. There is an extensive literature on comparisons between different methods for determining cause of death, which show substantial inter–method variations. A review of clinical cause of death assignment and post–mortem findings found rates of discrepancies ranging from 30% to 63% across the 18 included studies [26]. Pre–mortem CT imaging has been evaluated as only able to correctly identify 66% of post–mortem examination causes of death [27]. In South Africa, an autopsy series on miners found that 51% of respiratory infections diagnosed at autopsy had not been noted clinically [28]. There is a clear need to improve future VA methods by validating causes of death directly against post–mortem findings, but that is a major undertaking given the widespread lack of autopsies undertaken in Africa and Asia [29]. Against this background of high discrepancy rates between post–mortem findings and other methods of assigning cause of death, the relatively good agreement between PCVA and InterVA–4 findings here is encouraging, even though both might differ from post–mortem findings if those were available.
Attempts have been made to validate VA approaches in specific studies with hospital or laboratory data [30]. Some specific causes of death are amenable to this approach, for example by using particular data sets where ante–mortem HIV or sickle–cell status is documented [31,32]. A study from the Population Health Metrics Research Consortium recruited tertiary facility deaths across a range of hospital–assigned pre–determined causes, which were followed up with VA interviews [33]. This data set was used to build new models for assigning cause of death, which were then tested together with other models and physician assigned causes in the same data set. Unsurprisingly, models built within this data set performed better in relation to the hospital causes than either other models or physicians [34]. Further bench–testing of VA interpretation models showed roughly equivalent performance across various models when compared to PCVA as the reference standard [35]. By defining performance in relation to PCVA, however, these evaluations precluded comparison of public health consistency between models and physicians.
Analytical methods for comparing cause of death assignment are not entirely straightforward, because of the general uncertainty associated with cause of death, the interplay between precipitating and underlying causes, and the nature of the data. Here we have concentrated on comparing CSMFs, since that is the primary outcome of interest from cause of death data in public health. The concordance correlation coefficients and rank equivalence tests used here present accessible and convenient summary measures of how CSMFs from two different sources compared. For individual cause comparisons by factors such as source, age–group and sex, the ratio between CSMFs by the two methods provides insight on specific aspects for comparison, and the confidence interval of that ratio is informative in deciding whether or not differences are due to chance. It has been suggested that comparisons between cause of death methods should be corrected for chance agreement, which is more likely to occur in common causes [36]. However, from a public health perspective this is not necessarily appropriate, since in practice agreement is generally accepted irrespective of the possibility that it was derived by chance.
The overall size and geographic diversity of the data presented here are important attributes. These VA data were not collected under carefully controlled and standardised procedures in order to minimise real–life sources of variation; this is a major strength of this study. The sources deliberately included a mix of high and low HIV and malaria settings, which are the two causes of highest variation in CSMF findings between specific settings. In any cause of death data, a relatively small number of more common causes account for the majority of the deaths, followed by many causes accounting for small fractions in the remainder. Consequently it is only possible to evaluate cause of death methods thoroughly in data sets which are large enough to include realistic numbers of rarer causes. Globally, most unrecorded deaths occur in Africa and Asia, which are therefore the regions where VA methods are most urgently needed, and which are represented in these data. It must also be noted that inevitably none of these archived data sets were originally collected under the WHO 2012 VA standard, and hence some degree of inter–site variation may have been introduced in the process of extracting the necessary VA indicator data.
One commonly contentious area in terms of cause of death is the interaction between HIV/AIDS and pulmonary TB. Three of the six data sources included substantial numbers of HIV/AIDS deaths during the periods covered by these data, and both InterVA–4 and PCVA findings reflected that. A validation study for InterVA–4 in relation to HIV sero–status showed high specificity for HIV/AIDS as a cause of death (ie, relatively few false–positive HIV/AIDS cause assignments) but also showed considerably elevated mortality rates among sero–positives for causes such as pneumonia and pulmonary tuberculosis [31]. Although ICD–10 coding in principle requires the use of codes B20–B24 where HIV and co–infections are involved, the extent to which this can reliably be implemented using VA methods is debatable, particularly if VA respondents are unaware of the HIV status of the deceased. In these analyses, there are clear differences between the two South African sources in this respect, with appreciably different proportions of deaths assigned as HIV/AIDS or tuberculosis. Conversely, in low HIV/AIDS or malaria settings, physicians may be reluctant to assign deaths to those causes. For example in the Afghan data set, where very few HIV/AIDS deaths might be expected, HIV/AIDS was explicitly mentioned in four VA interviews, but this was not reflected in the PCVA results, which never assigned HIV/AIDS as a cause of death.
Any cause of death assignment process, at the individual level, will involve some degree of uncertainty. Formal procedures for assigning cause of death, for example in official death certificates, do not generally capture this uncertainty, but require the certifier to make a clear choice between possible causes [8]. Even if two certifiers are required to assess a case independently, as is often practised in PCVA, agreement does not necessarily constitute truth. One factor that emerges clearly from these analyses is that in the PCVA findings there is a greater tendency for physicians to choose chapter residual categories (pink markers in Figure 1 ), rather than specific causes (blue markers in Figure 1 ). This is evident from most of the pink markers lying below the line of equivalence, and is probably an expression of PCVA uncertainty. This was particularly evident in the neonatal age group, in addition to cross–over between neonatal sepsis and pneumonia categories, as seen in Online Supplementary Document, Table s2, resulting in the lower correlation observed for neonates. On the other hand, InterVA–4, by using a probabilistic model, computes a residual uncertainty for each case which is then expressed as an indeterminate component. By expressing uncertainty in this way, CSMFs for indeterminate causes may be greater according to InterVA–4.
Given the inherent difficulties and uncertainties involved in assigning cause of death, and the urgent need to implement large–scale, cost–effective CRVS procedures that include cause of death, it is clear that the priority for the foreseeable future in many low– and middle–income countries will be to undertake VA with automated cause of death assignment. We have shown here, using a large and diverse data set, that there is a strong correlation between in–country PCVA findings and outputs from the freely available InterVA–4 model, over a wide range of settings. Whilst accepting that neither PCVA nor InterVA–4 results necessarily represent absolute truth, and that there is a continuing search for improved methods for assigning causes of death, the use of InterVA–4 represents a low–resource and highly consistent strategy, which is a major advance on knowing almost nothing about cause of death profiles in many populations. The diversity of cause of death profiles which InterVA–4 produces across the various sources clearly demonstrates that a standard model can be used successfully over a wide range of settings. InterVA–4, and the WHO 2012 VA standard with which it is fully compatible, should therefore be used as the currently available tools of choice for filling gaps in cause–specific CRVS data.