


South Africa is one of the countries worst affected by the HIV pandemic. In 2011 there were estimated to be 5.6 million people infected with HIV, with an HIV prevalence of 17.6% for those aged between 15 and 49 [1]. In recent years the outlook for those infected has improved considerably with the percentage of those requiring antiretroviral treatment (ART) who are receiving the drugs increasing from 30% in 2009 [2] to 75.2% in 2011 [3]. The impact of ART programmes in reducing HIV related mortality and increasing life expectancy has been reported in a number of studies in subSaharan Africa [47]. However, the analysis of trends at a national, regional or district level may mask important local variations. It is important to understand this microlevel variation in order to effectively target interventions [812] as behaviours linked to higher or lower risk may be clustered in local communities [13,14].The data required for such detailed analyses are often only available in sites where the dynamics of a population can be followed in detail over time. Hence, Health and Demographic Surveillance Sites (HDSSs) provide the ideal platform for such analyses. [15,16]. Wand and Ramjee [10,11,14] identified local high prevalence spatial clusters of HIV and sexually transmitted infections amongst women in the Greater Durban area of Kwa Zulu Natal in South Africa. Tanser and colleagues [12] reviewed data from studies in various subSaharan African countries to provide evidence for the likely benefit of targeted interventions aimed at high risk groups to supplement more general population level approaches to HIV prevention.
Here we describe changing spatial patterns in the local development of an HIV epidemic over a period of time during which a health centre was established in order to test and treat those infected with HIV in addition to providing general health care for the local community. The goal of this analysis was to gain an understanding of which communities and subcommunities have benefitted preferentially from the enhanced access to treatment and those for which the situation may have deteriorated. By use of a grid overlay we were able break down communities into smaller subunits and calculate causespecific mortality trends in each of the grid squares. We also used clustering techniques to obtain complementary information on areas and periods of time where mortality risks differed from those expected. Clustering methods have been used previously to investigate HIV related mortality patterns in a rural South African setting, indicating the value of the technique in identifying locations for targeted interventions [8,17]. Using these multiple methodologies we were able to gain a fine grained understanding of the localised epidemic dynamics.
Location of the study
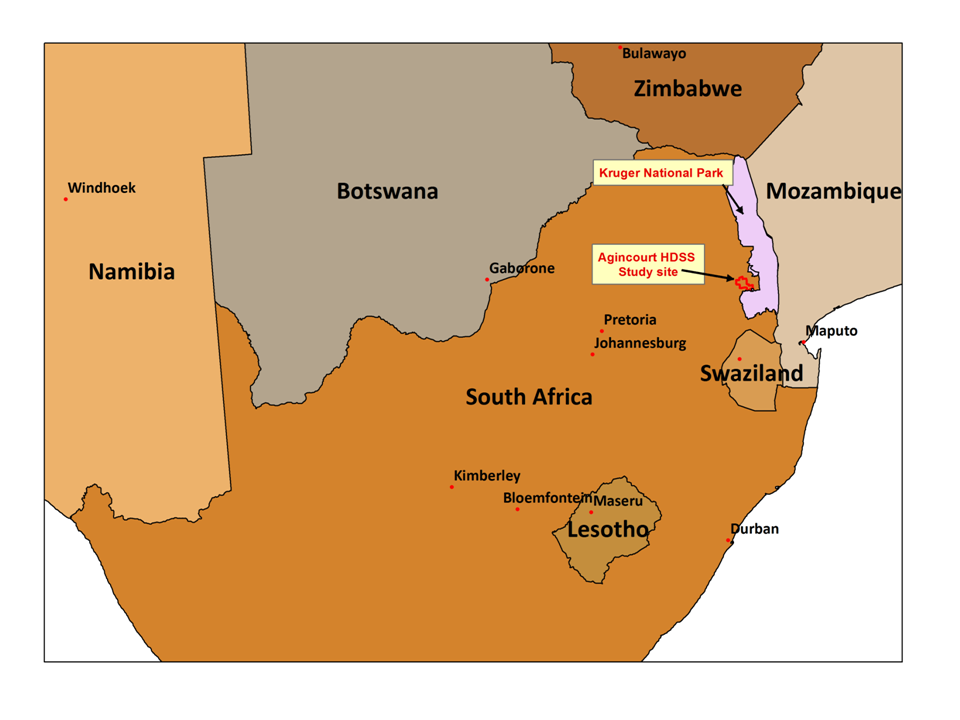
This study was carried out in the Agincourt Health and SocioDemographic Survey site (AHDSS) located in the Bushbuckridge subdistrict of Ehlanzeni municipality of Mpumalanga province in South Africa. [18] The site runs alongside the Kruger National Park and is close to the border with Mozambique ( Figure 1 ). Approximately one third of the population are of Mozambican ethnic origin, mainly refugees from the Mozambican civil war. A number of the preexisting villages gave over land in which 'Mozambican' settlements were established. These were initially characterised as having poorer levels of infrastructure and greater poverty than the established villages [19]. These former refugee communities are mainly located in the eastern part of the study site.
The area is predominantly rural though close to a number of periurban settlements. It is characterised as having high unemployment, a high level of poverty and relatively poor levels of educational attainment [18]. This has resulted in a high level of outmigration for economic reasons. Often the migrants retain strong connections with their original households and financial remittances from migrants are an importance source of income [20].
The baseline census for the AHDSS was carried out in 1992, and the present annual cycle of household followup visits was established in 1999. In 2007 the study site population was approximately 73 000 individuals. In order to maintain anonymity alphabetical identifiers rather than names are used to identify the villages in this study.
Population distribution
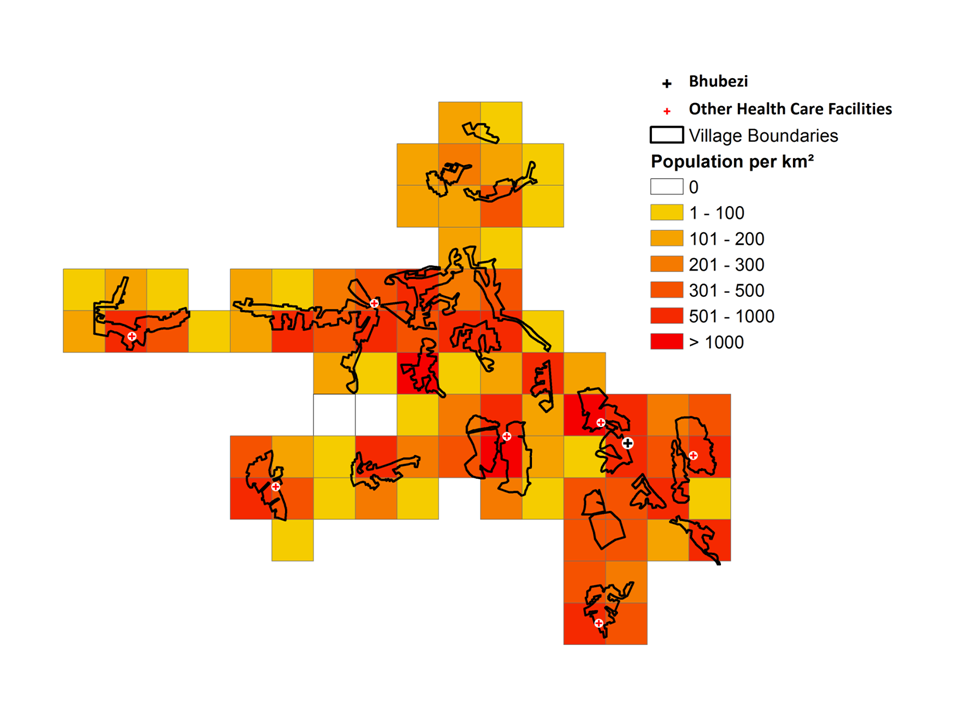
The study site is made up of discretely bounded villages ( Figure 2 ). Central areas of the villages often have a maximum population density greater than 1000 people/km2 which is more typical of an urban area in this region. The northern portion of the study site generally has a lower population density than the western and central parts.
ART and VCT provision in the Agincourt site
Effective ART became available worldwide in the mid 1990s. In South Africa, however, the treatment only became available in the public sector in 2004 [2]. Subsequently there were delays in rolling out ART across the country particularly in rural areas such as that in which the Agincourt HDSS is located.
In 2002 a programme was introduced to provide voluntary counselling and HIV testing (VCT) services in the 5 health centres operating in the study area [21]. Prior to this VCT had only been available outside the site. Two of the secondary level hospitals serving the population in the study site began to provide ART treatment between 2004 and 2005. To improve clinic access a programme of decentralisation of ART services began in 2008 when a clinic in the study site (Agincourt) and another in a periurban settlement (Thulamahashe) just to the west of the site started to provide ART. At the same time a community health centre, Bhubezi, initially operating outside the public sector and providing general health care with an emphasis on HIV testing and treatment was established. Throughout this period ART was available from private providers.
This study examines changes in mortality in two consecutive time periods 20072008 and 20092010 the periods immediately before and after the possible effects on mortality of the decentralised ART provision from the Bhubezi health centre would be expected to be evident.
Data used in the study
The core information captured in the annual AHDSS rounds were updates of the residency status and vital information for all household members. This was collected by interviewing the most knowledgeable available representative. For all deaths reported, a detailed verbal autopsy (VA) interview was carried out. The latitude and longitude of every dwelling was captured. Residents of two villages which were added to the site in 2009 were excluded from the analysis. The study population was restricted to males and females aged 15 years and above.
Cause of death (CoD) was assigned using the InterVA4 model [22,23]. The InterVA4 input variables are based on the questions in the standardised World Health Organisation (WHO) VA instrument released in 2012 [24]. A computer implementation of the InterVA4 probabilistic model is freely available for download from http://www.interva.net . InterVA4 uses a Bayesian probabilistic technique to calculate the likelihood of a particular cause of death for an individual based upon the presence or absence of particular signs or symptoms. An important advantage of the InterVA model over clinicians' assessments is the consistency in cause of death ascertainment over time. A multicentre validation study of the InterVA4 model against known HIV serostatus has shown good validity [25].
The variables required for the InterVA4 input were derived from the responses given to the Agincourt VA questionnaire. In addition to directly matching variables, key words or phrases from narrative fields which were specifically associated with InterVA4 input variables were identified. To overcome misspelling in the narratives, a string similarity matching algorithm (JaroWinkler) [26] was applied to identify similar strings, a cutoff score of 0.9 was used to define a match. These matches were checked manually. The matching algorithms were programmed using routines implemented in TSQL, the proprietary implementation of the SQL standard in the SQL*ServerTM 2008 software package. [Microsoft Corporation, Redmond, Washington USA].
Figures from 2009 [27] indicate that around 70% of those infected with tuberculosis are coinfected with HIV in South Africa. Due to this high level of comorbidity deaths due to HIVrelated disease (WHO VA code 01.03 HIV/AIDS related death) and pulmonary tuberculosis (WHO VA code 01.09) were joined in a single category, HIV/TB. All other deaths for which a CoD was available were categorised as nonHIV/TB.
Analytical approach
Mortality rates were directly standardised by age and gender in each 2-year period using the age/gender proportions of the entire site in the relevant period as the standard. The adult population was subdivided into 3 categories for the standardisation; 15 to 49, 50 to 65 and over 65. The standardised rates and the associated 90% confidence intervals (CI) were calculated using Stata, version 10.0 SE (Stata Corp., College Station, Texas, USA). ChiSquared values and Student Ttests were used to compare the effect of indeterminate cause of death data.
An initial comparison of mortality patterns aggregated the individuals into their villages of residence. This approach was based on that of previous studies [28,29] where mortality clusters were identified using village centroids. A rationale for this approach is that within the study site each village is geographically isolated from the others with its own leadership which to some extent can influence local characteristics. However there is also likely to be intravillage heterogeneity which such an analysis may not identify. A study of national HIV prevalence data in South Africa [9] emphasised the danger in aggregating data only by province as this led to a loss of understanding of localised prevalence levels for communities which crossed provincial boundaries. A similar problem exists with villagelevel aggregation. For this reason, a grid was created extending across the site. After investigating various grid sizes a 2 × 2 km grid was chosen in order to give reasonable numbers of deaths and strataspecific populations in each square. A previous study of mortality patterns in the Butajira HDSS site in Ethiopia used a similar approach in order to get a more fine grained understanding of spatiotemporal mortality patterns [30].
The person years at risk were calculated for each individual in each of the two year time periods using the start of the period to begin the residence episode and either an end event, outmigration, death or the end of the period to rightcensor the person time accrued. Mortality rate ratios were calculated for each grid square or village. In the grid analysis, if the lower bound of the 90% CI of the rate or rate ratio was higher than the mean value for the site that was classified as a significantly high value. Similarly if the upper bound was less than the mean this was classified as a grid square with a significantly low value. The grid and population density maps were developed using the ArcGIS software (ESRI 2011. ArcGIS Desktop: Release 10. Redlands, CA: Environmental Systems Research Institute). Other studies have suggested that lengthy travel times to clinics can provide a significant barrier to access [3133], conversely better road links may also lead to greater opportunities for social mixing and hence a higher risk of exposure to infection [8]. Hence we assessed the proximity of areas of high or low mortality rates or rate ratios to the clinics and roads.
Spatiotemporal cluster analysis was carried out using Kulldorff's spatiotemporal scan statistic as implemented in the SaTScanTM software v9.1 to identify the location and evaluate the statistical significance of spatial and temporal clusters of mortality [34]. In this analysis a cylindrical scanning window is moved across the study area, so that each location of the window captures a unique set of individuals during a specific range of dates. The radius of each cylinder is allowed to vary. The height of the cylinder corresponds to a specific range of dates. To evaluate statistical significance, a comparison is made between the number of cases (eg, cause specific deaths) within the scanning window and the number of cases outside of that window using a maximum likelihood ratio test statistic. The centre of the scanning window moves in geographical space and time allowing significant high or low clusters of deaths in space and/or time to be identified. The population at each dwelling was derived from the total number of person years rounded to the nearest integer value with a minimum value of 1. The dates of death were aggregated by month. The maximum spatial and temporal windows used were 50% of the population at risk and 50% of the entire period (2 years) respectively. A Poisson probability model with a maximum of 999 MonteCarlo replications was used in the analysis. A cutoff P value of 0.2 was used to identify clusters of interest.
In order to obtain an objective measure of the degree of spatial homogeneity in the pattern of rate ratios, a calculation was made of the Global Moran's I statistic using the GeoDa software [35]. A distance weight matrix was created using rook contiguity to indicate the nearest neighbours associated with a particular grid square. A Global Moran's I statistic of close to zero indicates a random spatial distribution, values approaching +1 or 1 indicate that there is overall a high degree of spatial correlation.
Between 2007 and 2010, 3660 deaths were recorded in the study site. Of these, 567 (15.5%) were excluded from the analysis as a cause of death could not be assigned due to either the initial verbal autopsy not having been carried out or there being a lack of symptomatic data. For the remaining deaths, 2584 occurred in those aged 15 years and over. A further 13 deaths were excluded from the grid analysis as no geographical coordinates for the place residence of these individuals were available.
To assess the possible effects of indeterminate causes of death, an analysis was carried out of the spatial distribution of deaths with and without a CoD assignment for the entire study population. The spatial separation of the centroids of the home residences for the two categories was 464 m indicating that there was no significant spatial bias introduced. The percentage of indeterminate CoD assignments was greater in 2009 to 2010 than in 2007 to 2008 (16.3% compared with 15.7%, P = 0.014). There were more indeterminate CoDs for males than females (17.2% compared with 14.2%, P = 0.012). Also those with indeterminate CoDs were on average younger than those for whom a cause of death was assigned (36.7 years compared to 42.5 years, P < 0.001)
Village level analysis of mortality
HIV/TB mortality. There was a large range of values for the standardised mortality rates (SMRs) for HIV/TB during both time periods (see Table S1 in the Online Supplementary Document). The rate ratio between the latter and earlier period was 0.70 (90% CI = 0.640.77) indicating a decrease in the HIV/TB mortality rates of between 23% and 36% with a point estimate of 30%. The rate ratios (RR) for individual villages are shown in Figure 3 .
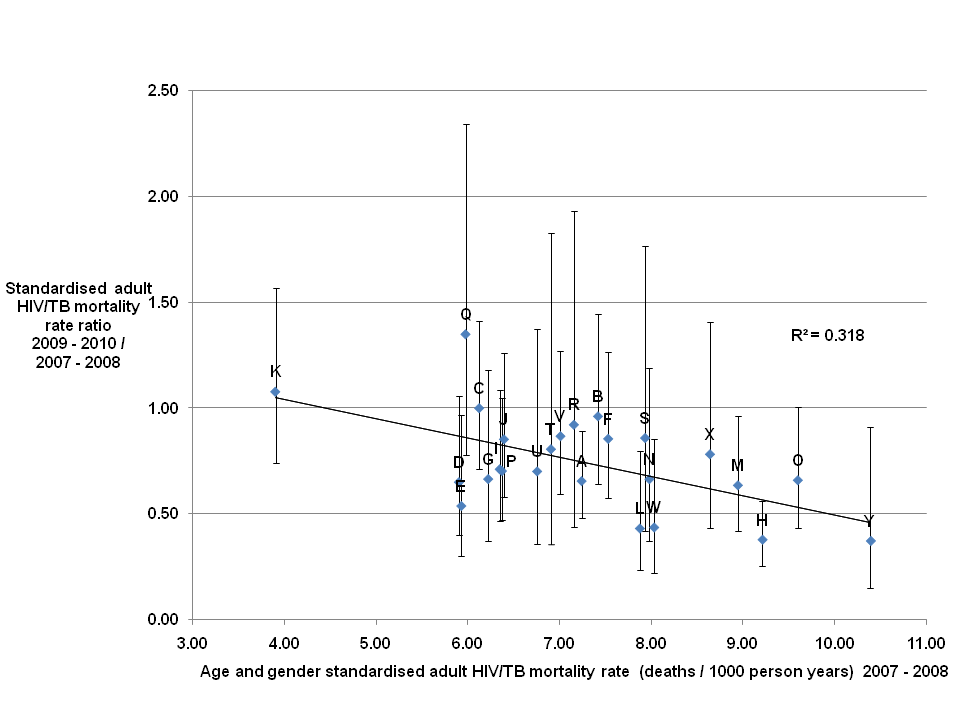
A rate ratio greater than 1 indicating an increase in the adult HIV/TB mortality rates was seen for two of the twentyfive villages (Q and K.) For twentytwo villages a decrease in the HIV/TB mortality rates were seen. However, for fourteen of these the upper bound of the 90% CI was greater than or equal to 1 indicating that the evidence for a decrease was weak. For one village the HIV/TB mortality rate remained unchanged.
Village Q had the highest rate ratio value of 1.35 (90% CI = 0.782.34) indicating a point estimate of a 35% increase in the HIV/TB mortality rate, as the lower bound of the confidence interval is less than 1 it is possible that there was a trend towards a decrease in the rate over the period. The lowest HIV/TB mortality rate ratios were 0.37 (90% CI = 0.150.91) for village Y, 0.38 (90% CI = 0.260.56) for village H and 0.43 (90% CI = 0.230.80) for village L, in each case the upper bound of the confidence interval is less than 1 indicating a rate decrease to be a reasonable interpretation. Villages H and L are geographically close neighbours to village Q.
The gradient of the trend line fitted to the plotted points ( Figure 3 ) was 0.091, indicating a decrease of close to 9% in the mortality rate ratio between the two periods for each unit increase in the mortality rate in the earlier period. The low R2 value of 0.318 showed that there was a significant amount of variation around this overall trend.
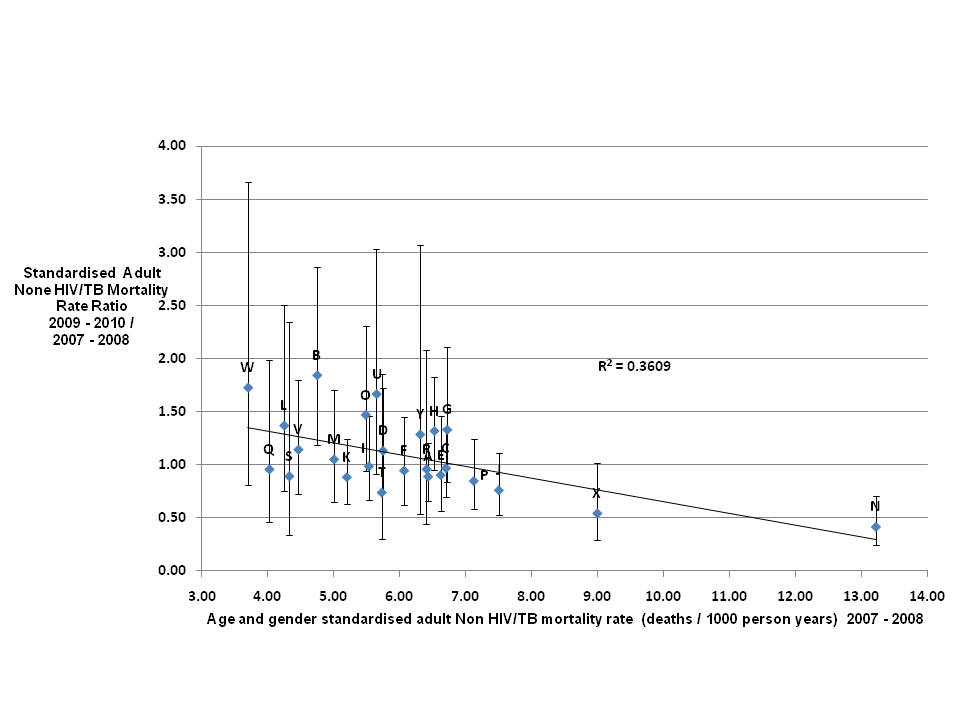
NonHIV/TB mortality. Similar to HIV/TB deaths, there were large variations between villages in the SMRs for deaths due to causes other than HIV/TB during both time periods (see Table S2 in the Online Supplementary Document). The standardised adult rate ratio for nonHIV/TB mortality between 2007 to 2008 and 2009 to 2010 was 1.01 (90% CI = 0.921.10) indicating that there was no overall change evident in the non HIV/TB mortality rates for adults between the two periods. The range in rate ratios was from 0.42 (90% CI = 0.250.71) for village N to 1.84 (90% CI = 1.192.86) for village W. With the upper bound of the rate ratio for village N less than 1 and the lower bound for village W greater than 1 it is reasonable to interpret this as evidence for significantly different changes in causespecific rates between the two.
The graph in Figure 4 shows a decrease in the rate ratio as the initial mortality rate increases with a gradient of 0.110 for the trend line. The R2 value of 0.361 again indicates significant variation around the overall trend.
Gridded mortality plots
HIV/TB mortality. Figure 5 shows the HIV/TB mortality rates in each grid square for 2007 to 2008 and 2009 to 2010. In 2007 to 2008 ( Figure 5 , upper panel), only two grid squares with significantly high rates were seen one at the extreme east of the site (10.41 deaths/1000 person-years, PY), the other towards the west (563.23 deaths/1000 PY). The latter was in a square with a very low population and thus likely to be a statistical outlier. Grid squares with significantly low standardised adult HIV/TB mortality rates were predominantly in the southern and western areas of the site with two additional squares located to the north of the Bhubezi health community health centre (Bhubezi).
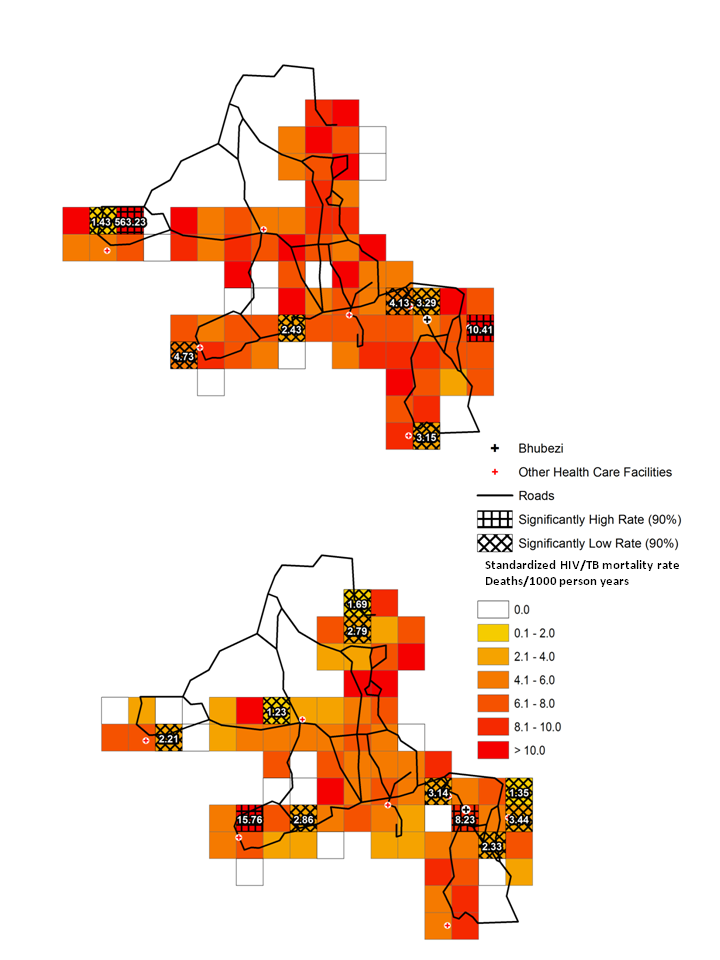
In 2009 to 2010 ( Figure 5 , lower panel) there were 4 grid squares with significantly low rates in the eastern region of the site in the area around Bhubezi. Other low rate grid squares were identified towards the west and north of the site. There were two grid squares with significantly high HIV/TB mortality rates one containing Bhubezi (8.23 deaths/1000 PY) and the other towards the southwest of the site (15.76 deaths/1000 PY)
The rate ratio plot ( Figure 6 ) shows four grid squares with significantly high rate ratios indicating an increase in the adult HIV/TB mortality rates between the two periods. One was located in the square containing Bhubezi (rate ratio = 1.39) and another directly to the north (rate ratio = 1.46), another was in the extreme south of the site (rate ratio = 2.67) and one towards the west (rate ratio = 3.22). Of the four grid squares with significantly low rate ratios, two were located to the east of Bhubezi. The rate ratios for these two squares are 0.20 and 0.33, indicating decreases of 80% and 67% respectively in the adult HIV/TB mortality rates in these regions. Other grid squares with low mortality rate ratios were seen in the north and west of the site.
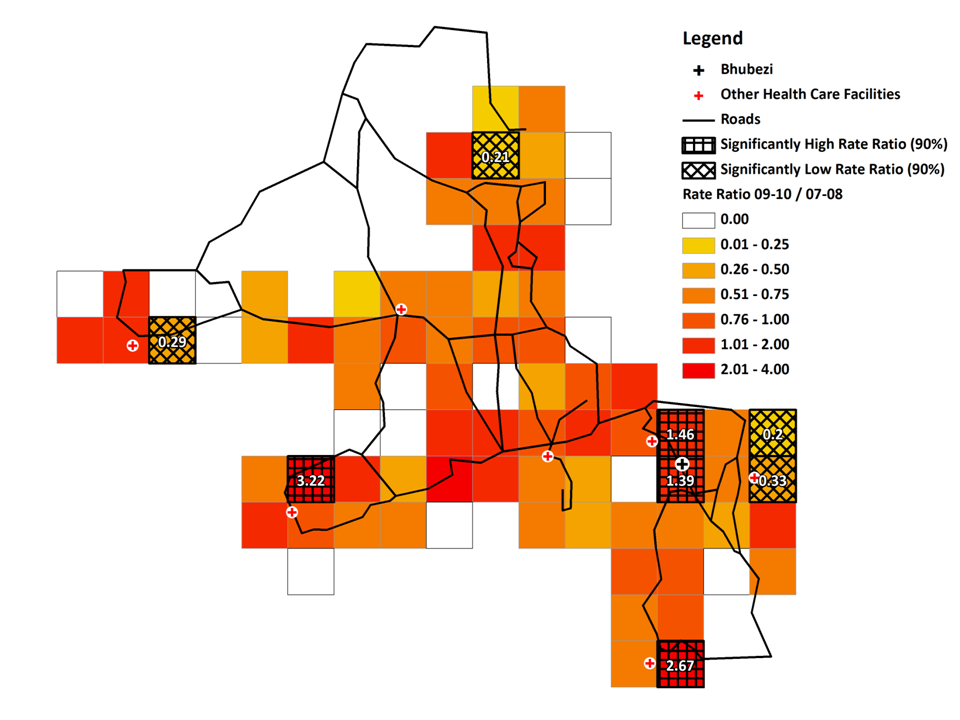
The Moran's I value for the HIV/TB mortality rate ratios was 0.03 indicating the spatial distribution of changes in HIV/TB mortality rates was essentially random with no evidence for global spatial correlation.
NonHIV/TB mortality. For adult deaths other than those caused by HIV related disease or TB, in the period 2007 to 2008, two grid squares with significantly high mortality rates were identified towards the north of the site and one in the south (see Figure S1 in Online Supplementary Document). In contrast, low rate grid squares were mainly found in the eastern, western and central areas of the site. In 2009 to 2010 the four grid squares showing significantly high rates were located in the eastern, southern and central regions of the site. There were eight grid squares with significantly low rates. These were distributed throughout the site other than in the extreme southern and western areas.
Two grid squares had significantly high rate ratio values, one just below Bhubezi (rate ratio = 2.23) and one towards the centre of the site (rate ratio = 1.92). Five grid squares showed significantly low rate ratios, one was just to the northeast of Bhubezi the others towards the centre of the site.
The Moran's I value for the nonHIV/TB rate ratios was 0.02 indicating the spatial variation in nonHIV/TB mortality rate changes was essentially random again showing no evidence for global spatial correlation.
Spatiotemporal clustering
For HIV/TB mortality two low risk clusters (1 & 2) and 1 high risk cluster (3) were identified as shown in Figure 7 . Cluster 1 (P = 0.04) was located in the centre of the site the time period was from August to December of 2010. Cluster 2 (P = 0.03) to the southeast of Cluster 1 was between November 2007 and September 2008. Cluster 3 had a lower level of statistical significance (P = 0.12), its time period from June 2007 to May 2008 partially overlapped that for cluster 2. It was located in the lower southeast region of the site.
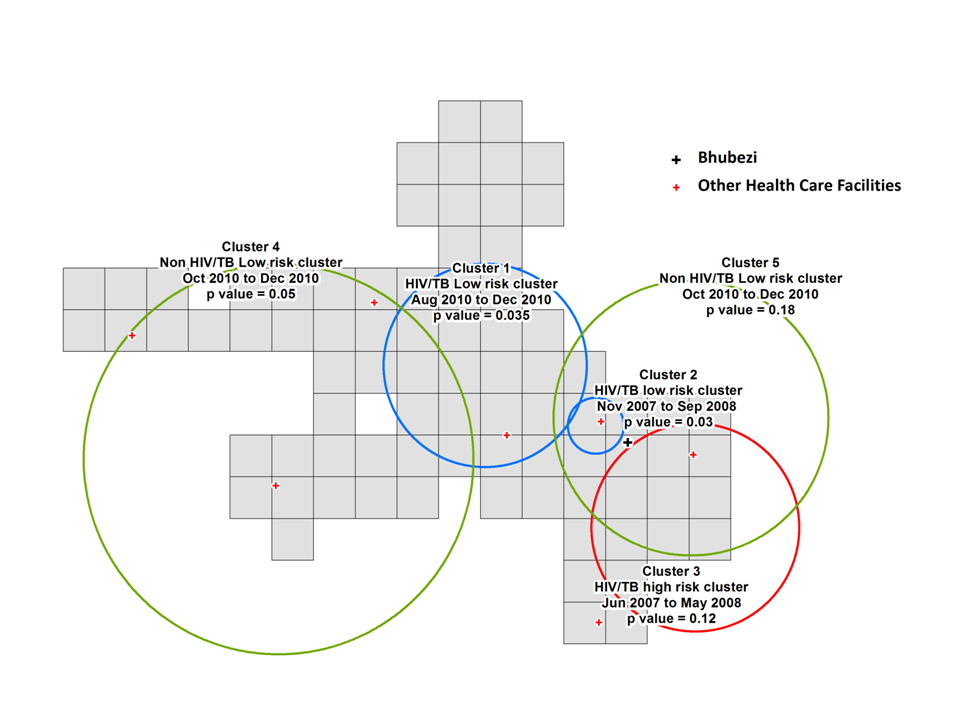
For the deaths due to causes other than HIV/TB, two low risk clusters were identified (4 & 5) over the same time period, October 2010 to December 2010. Cluster 4 (P = 0.05) covers a large area of the west and central region of the site, whilst cluster 5 with a low level of statistical significance (P = 0.18) covers a slightly smaller area towards the east of the site.
In this study three complementary techniques were used to investigate the changes in the geographical patterns of cause specific adult mortality over a period in which ART was rolled out and a community health centre opened in a rural South African community.
There was a 30% decrease in adult HIV/TB mortality between 2007 to 2008 and 2009 to 2010. However, for one community, village Q, there was a 35% increase in the adult HIV/TB mortality rate over the same period. As the rates were age and gender standardised, other factors must explain these differences. Village Q was originally established to provide homes for Mozambican refugees, this suggested that the ethnic profile of the village might be an important factor in determining the takeup of ART and subsequent decrease in mortality. However in our study we also found that in other predominantly Mozambican communities, such as villages L, R, S and T, there were decreases in the HIV/TB mortality rate over the same period. Hence ethnicity alone cannot explain the mortality changes. Furthermore, village L neighbours village Q, highlighting the geographical heterogeneity in the epidemic trajectories seen for closely neighbouring communities. This heterogeneity in rates between villages is consistent with patterns in all cause mortality identified between 1992 and 2007 [36] in this area.
The inverse relationship between the adult mortality rate ratio and the baseline adult HIV/TB mortality rate suggests that at a population level the impact of ART was greatest in the communities where the need was greatest. It is possible the higher HIV/TB mortality rates in some communities increased the awareness of the disease and hence the likelihood of individuals in those areas getting tested and starting treatment. Further qualitative studies would be needed to confirm whether this was the case.
There was no evidence of overall changes in adult mortality rates due to causes other than HIV related disease and pulmonary TB between the two time periods. This suggests that the reduction in HIV/TB mortality was explained by the provision of ART, rather than a general improvement in other aspects of health care provision in the area. However we do see highly heterogeneous patterns of change between different communities. Also the patterns of change in mortality rates differ markedly for the two categories of cause of death. An example of this is seen for village O which had a 37% increase in nonHIV/TB mortality and a 34% decrease in HIV/TB mortality, between
The analysis by grid square further emphasises the pattern of local heterogeneity and shows how this can also be seen at a subvillage level. As an example, the four populated grid squares located towards the extreme west of the site in the map of adult HIV/TB mortality ( Figure 6 ) are subsections of the same village. Three have increased HIV/TB mortality rates whilst the fourth shows a reduction of 71% between the earlier and later time periods. It is possible that the characteristics of the different subregions of the village are influenced by those of neighbouring communities.
The existence of clusters of high and low HIV/TB mortality towards the east of the study site ( Figure 7 ) also shows the local heterogeneity in the risk of death related to these conditions. In comparison, a study looking at infant HIV/TB deaths in the site between 2000 and 2005 identified high mortality risk hot spots in the central, southeastern and southwestern areas [37]. This analysis shows different geographical locations for the high and low risk clusters of mortality attributable to different causes consistent with a previous study of adult mortality patterns in the site from 19932010 [38].
Visual analysis showed no evidence for lower HIV/TB rate ratios in areas close to the clinics providing ART. A study in a rural area of KwaZuluNatal in South Africa showed that ART uptake was inversely related to the distance individuals lived from the clinic providing treatment [39]. Previous studies in this site did identify associations between the mortality risk and the straight-line distance between an individual's residence and local clinics [40,41].
These patterns have important implications for those planning new health facilities or initiating communitybased health interventions. Whilst it is important that the physical barriers to access are reduced, for example by locating new health centres in order to obtain the greatest reduction in travel times for the population which is served [31], consideration should also be made to the different morbidity patterns across the community. Furthermore as we see from the patterns of HIV/TB rate ratios in Figure 6 different areas within a short distance of the Bhubezi health centre saw very different epidemic trajectories over the period of the study. This suggests that to have an effective impact, the various barriers to access experienced by different subsections of the community, must be addressed [42]. Clearly there are issues of temporality in such an approach as we are making assumptions about levels of current illness based on past mortality levels. Also knowing the place of residence of an individual at the time of their death does not necessarily tell you where the person was exposed to the risk factors leading to death. This is especially important in an area like this where we see significant numbers of individuals returning from urban areas when their illness has progressed such that they are no longer able to maintain employment and live independently [43].
A potential limitation in this analysis is the rather high level of indeterminate causes of death. However there is no evidence that the indeterminate data introduced a spatial bias. The preponderance of indeterminate causes among younger individuals and males probably reflects patterns of temporary migration, with a number of those deaths occurring away from home and hence difficult to followup by verbal autopsy. As there was a slightly higher proportion of deaths for which no cause could be defined in 20092010 compared to 20072008 (16.3% vs 15.7%) we can assume that the cause specific mortality ratios are a slight underestimate. Also as relatively short time windows were used to accumulate the data, the numbers of deaths accrued was relatively low compared to previous studies [36] leading to relatively wide confidence intervals for the rates and rate ratios calculated.
The patterns that emerge from this study are complex. In some areas there appears to be a high level of intravillage coherence with individual villages showing distinct mortality characteristics which differ from those of neighbouring villages. In others the pattern is less clear. This work confirms the conclusions made by other studies in the region that identified heterogeneous pattern of microepidemics within a more generalised epidemic [1012,14,17]. Our results confirm trends shown by Tanser and colleagues [8] of considerable local geographic variation in HIV prevalence in a rural area of Kwa Zulu Natal South Africa. However spatial patterns of HIV related mortality will be affected by both the distributions of risk factors for infection and local availability of testing and treatment. In our case there are no obvious associations with the location of major roads crossing the site. This study shows that a microlevel analysis may be useful in mounting an appropriate public health response to HIV in a local area. In a further study, currently being prepared for publication, we assess the influence of various risk factors which may explain the spatial patterns that have been identified. Conclusions drawn from a spatial analysis such as is presented here can be used as a starting point for investigations of factors influencing the differing current morbidity patterns seen in different communities.
Geolocated cause specific mortality data as used in this analysis is often lacking in resource poor regions [44]. However a mobile phone based application which can be used to collect verbal autopsy data and assign causes of death, as well as automatically registering GPS coordinates, is now available [45]. This gives the potential in the future for a greater geographic coverage of mortality data beyond the existing limited number of research sites for which it is available.
UNAIDS and others have emphasised that in deciding how to respond to HIV one must "Know your epidemic" [46]. This study emphasises the importance of that approach.


