National as well as global programmes such as the WHO Global Malaria Programme (GMP) and The Global Action Plan for the Prevention of Pneumonia and Diarrhoea (GAPPD) strive towards a reduction in morbidity and mortality due to preventable childhood diseases [1,2]. Over the past decades, the prevalence of childhood diseases and related mortality have in fact been decreasing worldwide [3-5]. While this is in great part due to large-scale interventions such as vaccination programmes and other child health initiatives [5,6], economic development may generally also contribute through changes in the distribution of risk factors. Access to safe water and basic sanitation facilities, for example, has increased in recent years [7], thereby reducing the risk of diarrhoea on the individual level [8]. Similarly, as families move from traditional to modern, improved housing, the risk of malaria is reduced [9 ].
However, progress is unequally distributed and slowing down [2-4,10]. The poorest households often carry the highest disease burden [11-13]. Marginalised, hard-to-reach communities are underserved by crucial child health interventions and lack access to basic facilities in several countries [7 ,14]. Depending on which population groups benefit from large-scale health initiatives or general economic development, socioeconomic status may become a more relevant risk factor for childhood diseases. It is therefore important to assess how these risk factors change over time.
Evidence from single countries suggests that children in poorer households are at higher risk of being infected with childhood diseases. Kahabuka et al. found a positive association between risk of severe pneumonia and diarrhoea and lower socioeconomic status in Tanzania [15 ]. Similarly, wealthier people were found to have a lower risk of malaria infection in the Democratic Republic of Congo [16]. A few studies analyse the association between socioeconomic status and morbidity for country groups. Mfueni Bikundi and Coppieters identified household wealth status as important risk factor for malaria in sub-Saharan Africa [17 ]. Looking at all low- and middle-income countries, Fuller et al. compared diarrhoea prevalence among children from households that share sanitation facilities with children from households that use non-shared facilities and estimated that a large fraction of the difference in diarrhoea prevalence could be explained by differences in socioeconomic status [18].
We contribute to this evidence by analysing the association of socioeconomic status with highly prevalent childhood diseases, namely diarrhoea, acute respiratory infections (ARI), and malaria, over time. We present the change of the wealth gradient in disease prevalence. Due to limited data on malaria, we also look at fever as a proxy of malaria. Our regional focus is on Western and Central Africa, given that several of the countries with the highest burden of diarrhoea and pneumonia are located in Western and Central Africa, including Nigeria, the Democratic Republic of the Congo, Chad, Niger, and Côte d’Ivoire [6]. Similarly, the two countries with the most malaria cases in 2017 were Nigeria and the Democratic Republic of Congo [2]. Moreover, progress in reducing these prevalences has slowed down in Western and Central Africa over the past decades [ 10]. We use all Demographic and Health Surveys (DHS) as well as Multi-Indicator Cluster Surveys (MICS) from this region between 1995 and 2017 for which information on these childhood diseases is available.
Data
For this observational study, we used repeated cross-sectional, nationally representative survey data from Western and Central Africa. We combined two data sources, the DHS and MICS. The DHS is administered by ICF International. In seven rounds since 1984, the DHS Program has collected nationally representative data in low- and middle-income countries. MICS is a data collection initiative by UNICEF and has collected data on women and children in low- and middle-income countries since 1995. In both survey programmes, women in reproductive age, typically between 15 and 49, were asked for information on all children ever born to them. The surveys apply a multistage stratified sampling design for the within-country selection of households. For each country, regions were defined, within which the population was stratified into urban and rural. For each stratified area, enumeration areas were randomly drawn and denoted as primary sampling units (PSUs). Selection of PSUs was based on a probability proportional to size, in this case the number of households. Within each PSU, all households were listed from the most recent population census. Applying an equal probability systematic sampling, a fixed number of households in each PSU was selected for an interview. Weights for the calculation of nationally representative statistics are provided with the survey data. For the analysis across countries, we re-scaled weights using each country’s female population aged 15 to 49 years in the last year of the considered time period. This ensures that small countries do not excessively influence the estimation of overall disease prevalence.
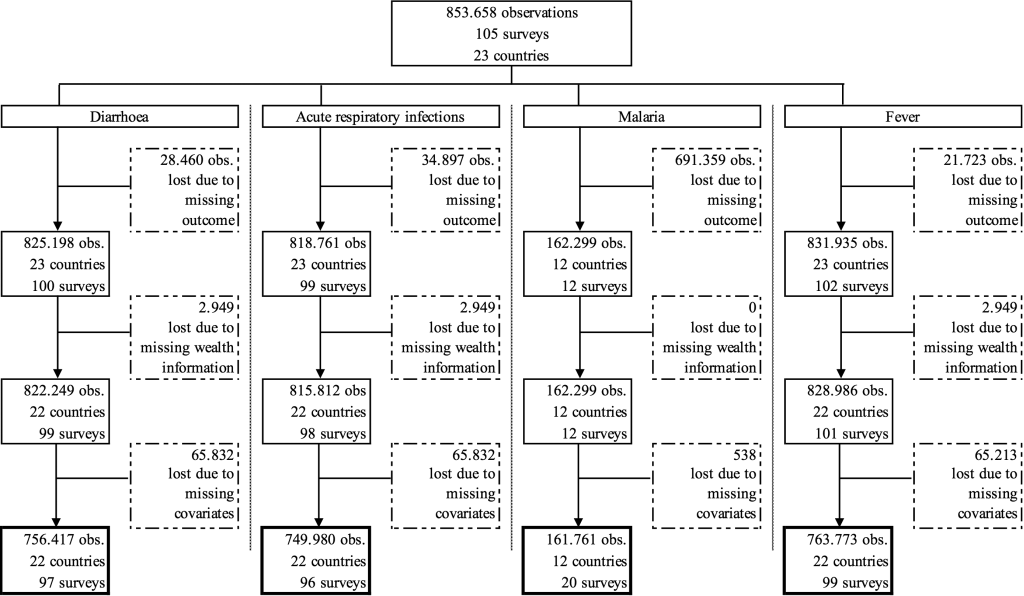
In this analysis, we included data from 1995 to 2017 for all countries in Western and Central Africa for which data for outcomes, exposure, and covariates was available. Observations with missing information in any of these variables had to be dropped. Figure 1 presents the sample selection in greater detail.
Outcomes
We analysed the association of socioeconomic status with three childhood diseases, namely diarrhoea, acute respiratory infections (ARI), and malaria, as well as fever as a proxy for malaria. All diseases were coded as dummy variables that equal one if the child has the disease. A child was defined as having diarrhoea or fever if his/her guardian responded that the child suffered from diarrhoea or fever in the past 24 hours. Malaria was identified by a positive result of the rapid diagnostic test. A child was defined as having ARI if he/she had cough in the past 24 hours and experienced short, rapid breathing. A stricter definition would identify the disease as ARI only if the breathing difficulties were related to a problem in the chest. However, only more recent surveys included the question whether the child’s difficulty in breathing was due to a problem in the chest or a blocked nose, which would not allow for an analysis of the change in the association. We looked at ARI as proxy for pneumonia, despite evidence that it is not a very accurate indicator [ 19,20]. Unfortunately, the DHS and MICS do not contain more accurate data on pneumonia such as diagnostic tests.
Exposure and covariates
To capture the socioeconomic status of a child’s household, we created an asset index of observed household assets. While many of the included surveys provided an asset index or a variable identifying the wealth quintile of a household, we preferred to calculate an asset index comparable across countries for as many surveys as possible. Our asset index was calculated using principal-component analysis to define asset-based survey-specific wealth quartiles based on the same list of assets for each survey. Included assets were radio, television, bicycle, car, motorcycle, refrigerator, phone, electricity, piped drinking water, flush toilet, floor material, wall material, and roof material. Households with information on less than 88% of underlying assets were excluded. This cut-off was chosen to include the maximum information about assets while retaining as many country-years as possible. Due to low variation in asset ownership in earlier years for some surveys, few wealth quartiles contain no actual observations.
Covariates used in the analysis for the prediction of disease prevalence, included the child’s gender and age in years, the mother’s age at birth of the child and her educational level (none, primary, or secondary and higher), as well as the location of the household (rural or urban).
Statistical analysis
In order to assess the change over time in the association between socioeconomic status and disease prevalence, we split the data into three time periods. Time periods were defined such that each country had at least one survey in each time period, as far as possible. This resulted in the earliest period containing surveys between 1995 and 2001, the middle period containing surveys between 2002 and 2009, and the most recent time period containing surveys between 2010 and 2017. Since rapid tests for identifying malaria were only conducted in more recent surveys, associations with malaria prevalence could only be shown for the recent time period.
We estimated the predicted prevalence of each disease for the whole sample in the three time periods, and repeated the analysis separately for each country to highlight heterogeneity between countries.
The predictions were based on regressions of the disease on the set of covariates mentioned above. Furthermore, we added survey year- and country-fixed effects as country level factors have been shown to influence childhood diseases such as diarrhoea [21]. No further sensitivity analyses were performed. All analyses were performed using Stata 14.
Figure 2 , Panels A-D show the predicted prevalence of diarrhoea, ARI, fever, and malaria for the whole region split by wealth quartiles for three different time periods. Overall, the wealth of the household is associated with the prevalence of the disease. Children from the poorest quartile are more likely to have a disease than children from the richest quartile. The associations differ across diseases and over time.
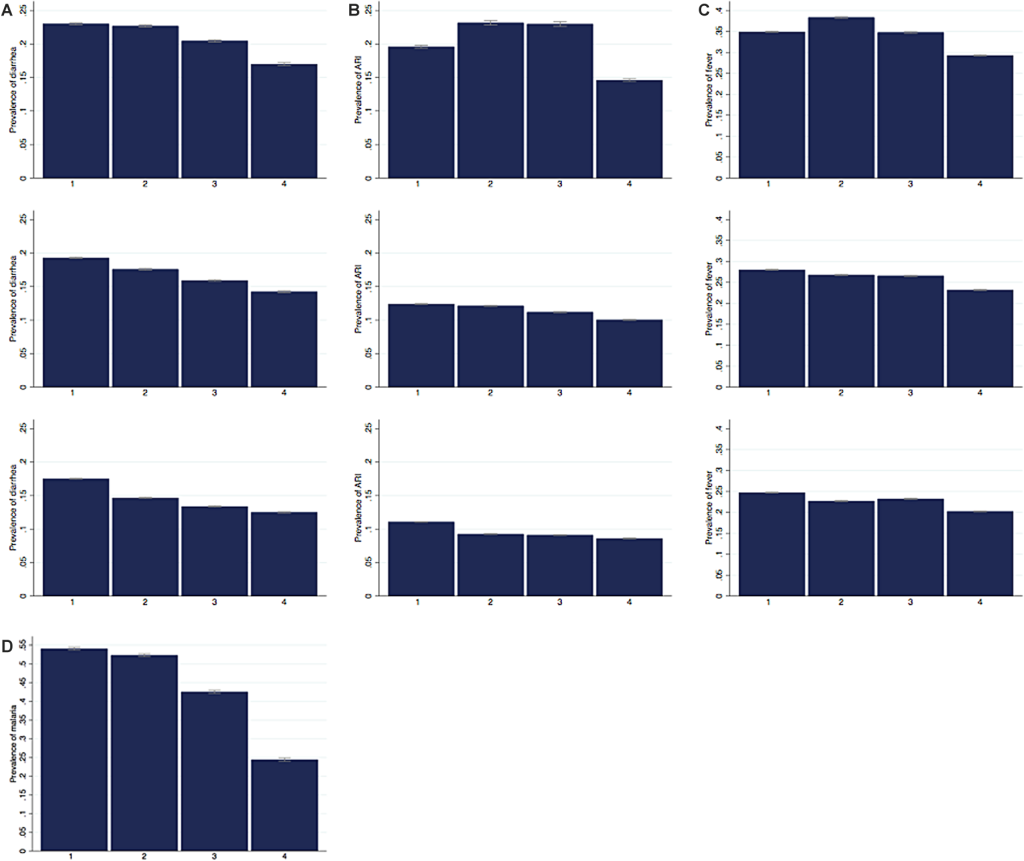
In the most recent period 2010-2017 the predicted prevalence of diarrhoea decreases with each wealth quartile ( Figure 2 , Panel A). It is 17.5% for children in the poorest quartile, 14.7% and 13.4% for children from the second and third wealth quartile respectively and 12.5% for children from richest quartile. This general pattern also characterises the prevalence in the two earlier time periods. Over time, the predicted prevalence decreased for all quartiles. The decline was relatively larger for the middle quartiles. In the first two periods, the difference between the poorest two quartiles was small with less than one percentage point, but it increased over time to be the largest difference between quartiles with 2.8 percentage points.
The predicted prevalence of ARI is depicted in Figure 2 , Panel B. While the overall prevalence of ARI is lower compared to the prevalence of diarrhoea, we find a similar picture in the most recent period despite slightly smaller differences between wealth quartiles. The prevalence of ARI is 11.1% for the poorest and 8.6% for the richest quartile. The difference between the second and third quartile is negligible. Interestingly, for the earliest period between 1995 and 2001, the predicted prevalence is highest for the second and the third quartile. The prevalence rates declined remarkably over time for all wealth quartiles, the largest reductions being achieved in the second and third quartile.
For fever, the differences of the predicted prevalence between the wealth quartiles are smaller ( Figure 2 , Panel C). The predicted prevalence is 24.7% for the poorest quartile, and 22.7%, 23.2% and 20.2% for the quartiles two to four respectively. Similar to the pattern observed for ARI, in the earliest period the predicted prevalence is highest for children from the second and third wealth quartile. In all quartiles, the prevalence decreased considerably between the early and the middle time period but only slightly between the middle and the most recent period.
Data on malaria is only available from more recent surveys and for selected countries. We therefore present the predicted prevalence for malaria in the most recent period ( Figure 2 , Panel D). The prevalence rate is high overall. This is in part driven by data availability since rapid malaria tests are only included in the surveys in malaria endemic countries. The difference in malaria prevalence between the richest and poorest quintile is considerable, with 54.1% in the poorest and 24.4% in the richest quartile.
We also analysed whether wealth has a different association with childhood diseases for boys and girls. Figure S1, Panels A-D in the Online Supplementary Document , replicates Figure 2 , Panels A-D, disaggregated by gender. While girls have a slightly lower predicated prevalence of diarrhoea and to a lesser extent of ARI and fever compared to boys, the pattern of the wealth gradient is exactly the same for both genders.
Tables 1 to 4 Table 2 Table 3 Table 4 show the predicted prevalence by wealth quartile for each country for the first and most recent survey. Overall, the general pattern persists with a lower predicted prevalence for richer households compared to poorer households and a decrease in the predicted prevalence rate from the first to the most recent observation. However, the picture is very heterogeneous between countries, regarding levels, wealth gaps, and trends.
| Year | WQ 1 | WQ 2 | WQ 3 | WQ 4 | Diff | Ratio | |
|---|---|---|---|---|---|---|---|
| Benin | 1996 | 0.172 (0.167 to 0.177) | 0.167 (0.161 to 0.173) | 0.159 (0.153 to 0.166) | 0.144 (0.136 to 0.152) | 0.028 | 1.194 |
| 2017 | 0.124 (0.123 to 0.125) | 0.112 (0.111 to 0.114) | 0.107 (0.106 to 0.108) | 0.086 (0.084 to 0.087) | 0.039 | 1.451 | |
| Burkina Faso | 1998 | 0.199 (0.196 to 0.202) | 0.210 (0.207 to 0.212) | 0.203 (0.200 to 0.207) | 0.201 (0.198 to 0.205) | -0.003 | 0.986 |
| 2010 | 0.146 (0.144 to 0.148) | 0.157 (0.155 to 0.158) | 0.150 (0.148 to 0.152) | 0.148 (0.145 to 0.150) | -0.002 | 0.988 | |
| Cameroon | 1998 | 0.160 (0.151 to 0.169) | 0.131 (0.120 to 0.141) | 0.104 (0.097 to 0.112) | 0.085 (0.079 to 0.091) | 0.074 | 1.874 |
| 2014 | 0.262 (0.256 to 0.269) | 0.205 (0.198 to 0.212) | 0.162 (0.156 to 0.168) | 0.127 (0.122 to 0.131) | 0.136 | 2.070 | |
| Central African Republic | 2000 | 0.267 (0.264 to 0.270) | 0.255 (0.252 to 0.258) | 0.252 (0.247 to 0.257) | 0.255 (0.252 to 0.258) | 0.011 | 1.045 |
| 2010 | 0.253 (0.250 to 0.256) | 0.236 (0.232 to 0.239) | 0.234 (0.231 to 0.237) | 0.238 (0.234 to 0.242) | 0.015 | 1.062 | |
| Chad | 1996 | 0.224 (0.221 to 0.227) | 0.221 (0.217 to 0.225) | 0.215 (0.211 to 0.219) | |||
| 2014 | 0.226 (0.223 to 0.229) | 0.225 (0.222 to 0.228) | 0.239 (0.236 to 0.242) | 0.215 (0.212 to 0.218) | 0.011 | 1.050 | |
| Congo | 2005 | 0.145 (0.140 to 0.150) | 0.148 (0.143 to 0.154) | 0.139 (0.133 to 0.145) | 0.136 (0.131 to 0.142) | 0.009 | 1.064 |
| 2014 | 0.175 (0.172 to 0.178) | 0.186 (0.182 to 0.190) | 0.180 (0.175 to 0.185) | 0.168 (0.161 to 0.175) | 0.007 | 1.041 | |
| Congo Democratic Republic | 2001 | 0.204 (0.201 to 0.208) | 0.227 (0.223 to 0.230) | 0.229 (0.227 to 0.231) | |||
| 2013 | 0.167 (0.165 to 0.169) | 0.175 (0.172 to 0.177) | 0.180 (0.177 to 0.182) | 0.171 (0.168 to 0.174) | -0.004 | 0.976 | |
| Cote d'Ivoire | 1998 | 0.235 (0.227 to 0.242) | 0.241 (0.235 to 0.247) | 0.220 (0.212 to 0.228) | 0.205 (0.199 to 0.211) | 0.030 | 1.144 |
| 2016 | 0.166 (0.164 to 0.169) | 0.171 (0.168 to 0.174) | 0.150 (0.146 to 0.153) | 0.128 (0.123 to 0.133) | 0.038 | 1.301 | |
| Gabon | 2000 | 0.183 (0.178 to 0.188) | 0.179 (0.172 to 0.186) | 0.185 (0.178 to 0.193) | 0.147 (0.140 to 0.154) | 0.036 | 1.248 |
| 2012 | 0.193 (0.187 to 0.198) | 0.179 (0.172 to 0.186) | 0.177 (0.167 to 0.186) | 0.135 (0.126 to 0.144) | 0.058 | 1.429 | |
| Gambia | 2000 | 0.214 (0.209 to 0.220) | 0.220 (0.215 to 0.225) | 0.215 (0.209 to 0.221) | 0.205 (0.198 to 0.213) | 0.009 | 1.045 |
| 2013 | 0.181 (0.178 to 0.184) | 0.185 (0.182 to 0.189) | 0.177 (0.173 to 0.182) | 0.164 (0.157 to 0.170) | 0.017 | 1.106 | |
| Ghana | 1998 | 0.211 (0.208 to 0.214) | 0.180 (0.176 to 0.184) | 0.181 (0.176 to 0.186) | 0.132 (0.127 to 0.137) | 0.078 | 1.594 |
| 2014 | 0.155 (0.153 to 0.158) | 0.120 (0.117 to 0.123) | 0.117 (0.114 to 0.120) | 0.065 (0.060 to 0.069) | 0.091 | 2.398 | |
| Guinea | 1999 | 0.219 (0.216 to 0.222) | 0.217 (0.214 to 0.220) | 0.216 (0.213 to 0.220) | 0.222 (0.219 to 0.226) | -0.003 | 0.985 |
| 2016 | 0.108 (0.105 to 0.110) | 0.102 (0.099 to 0.105) | 0.099 (0.096 to 0.102) | 0.101 (0.098 to 0.105) | 0.006 | 1.063 | |
| Guinea-Bissau | 2006 | 0.123 (0.120 to 0.126) | 0.122 (0.118 to 0.126) | 0.129 (0.124 to 0.133) | 0.139 (0.135 to 0.143) | -0.016 | 0.886 |
| 2014 | 0.113 (0.111 to 0.115) | 0.120 (0.118 to 0.123) | 0.125 (0.122 to 0.128) | 0.130 (0.126 to 0.135) | -0.017 | 0.867 | |
| Liberia | 2006 | 0.208 (0.204 to 0.212) | 0.223 (0.218 to 0.228) | 0.221 (0.216 to 0.225) | 0.191 (0.184 to 0.199) | 0.017 | 1.088 |
| 2013 | 0.234 (0.231 to 0.237) | 0.239 (0.234 to 0.243) | 0.235 (0.230 to 0.240) | 0.215 (0.208 to 0.222) | 0.019 | 1.091 | |
| Mali | 1995 | 0.170 (0.165 to 0.175) | 0.169 (0.163 to 0.174) | 0.165 (0.160 to 0.169) | 0.142 (0.138 to 0.146) | 0.028 | 1.196 |
| 2015 | 0.163 (0.161 to 0.165) | 0.159 (0.158 to 0.161) | 0.149 (0.148 to 0.151) | 0.117 (0.115 to 0.119) | 0.046 | 1.388 | |
| Mauritania | 2007 | 0.234 (0.232 to 0.236) | 0.225 (0.222 to 0.227) | 0.213 (0.211 to 0.215) | 0.185 (0.183 to 0.188) | 0.049 | 1.265 |
| 2015 | 0.209 (0.207 to 0.211) | 0.198 (0.196 to 0.200) | 0.188 (0.186 to 0.190) | 0.161 (0.158 to 0.164) | 0.048 | 1.299 | |
| Niger | 1998 | 0.265 (0.259 to 0.272) | 0.254 (0.248 to 0.261) | 0.228 (0.221 to 0.234) | |||
| 2012 | 0.163 (0.161 to 0.166) | 0.142 (0.139 to 0.144) | 0.144 (0.141 to 0.147) | 0.122 (0.118 to 0.126) | 0.041 | 1.335 | |
| Nigeria | 1999 | 0.118 (0.114 to 0.123) | 0.102 (0.097 to 0.106) | 0.083 (0.080 to 0.086) | 0.068 (0.064 to 0.071) | 0.050 | 1.742 |
| 2013 | 0.151 (0.149 to 0.152) | 0.114 (0.112 to 0.117) | 0.073 (0.071 to 0.075) | 0.056 (0.054 to 0.058) | 0.095 | 2.715 | |
| Sao Tome and Principe | 2000 | 0.179 (0.171 to 0.186) | 0.186 (0.177 to 0.196) | 0.184 (0.176 to 0.191) | 0.160 (0.150 to 0.170) | 0.019 | 1.116 |
| 2014 | 0.190 (0.183 to 0.197) | 0.186 (0.180 to 0.191) | 0.184 (0.176 to 0.191) | 0.175 (0.165 to 0.184) | 0.016 | 1.089 | |
| Senegal | 1997 | 0.180 (0.177 to 0.183) | 0.154 (0.151 to 0.158) | 0.148 (0.144 to 0.152) | 0.125 (0.120 to 0.129) | 0.055 | 1.444 |
| 2017 | 0.208 (0.206 to 0.210) | 0.183 (0.180 to 0.186) | 0.174 (0.170 to 0.177) | 0.153 (0.148 to 0.157) | 0.055 | 1.360 | |
| Sierra Leone | 2000 | 0.267 (0.264 to 0.270) | 0.269 (0.266 to 0.273) | 0.253 (0.249 to 0.257) | 0.249 (0.244 to 0.255) | 0.018 | 1.072 |
| 2017 | 0.087 (0.085 to 0.088) | 0.085 (0.084 to 0.087) | 0.071 (0.069 to 0.073) | 0.066 (0.064 to 0.068) | 0.021 | 1.310 | |
| Togo | 1998 | 0.218 (0.211 to 0.224) | 0.198 (0.191 to 0.204) | 0.190 (0.180 to 0.201) | 0.166 (0.159 to 0.173) | 0.052 | 1.313 |
| 2013 | 0.191 (0.188 to 0.194) | 0.165 (0.161 to 0.169) | 0.142 (0.138 to 0.147) | 0.100 (0.096 to 0.104) | 0.091 | 1.903 |
*Note: Predicted prevalence of diarrhoea across wealth quartiles for each country in the first and most recent survey. Predicted prevalence is calculated from a country-specific regression of disease on wealth controlling for child’s gender and age in years, mother’s age at birth of the child, mother’s educational level, location of the household (rural/urban), and survey-year fixed effects. 95% confidence intervals in parentheses. Column “Diff” contains the percentage point difference between the predicted prevalence in the poorest and richest wealth quartile. Column “Ratio” contains the ratio of the predicted prevalence rate in the poorest to that in the richest quartile (prevalence WQ1 / prevalence WQ4).
| Year | WQ 1 | WQ 2 | WQ 3 | WQ 4 | Diff | Ratio | |
|---|---|---|---|---|---|---|---|
| Benin | 1996 | 0.101 (0.098 to 0.104) | 0.100 (0.096 to 0.103) | 0.096 (0.092 to 0.100) | 0.089 (0.084 to 0.094) | 0.012 | 1.133 |
| 2017 | 0.065 (0.064 to 0.066) | 0.059 (0.058 to 0.059) | 0.057 (0.056 to 0.057) | 0.050 (0.049 to 0.050) | 0.015 | 1.309 | |
| Burkina Faso | 1998 | 0.140 (0.139 to 0.141) | 0.146 (0.144 to 0.147) | 0.136 (0.135 to 0.138) | 0.123 (0.121 to 0.124) | 0.017 | 1.142 |
| 2010 | 0.044 (0.044 to 0.045) | 0.051 (0.050 to 0.051) | 0.041 (0.041 to 0.042) | 0.029 (0.028 to 0.030) | 0.016 | 1.535 | |
| Cameroon | 1998 | 0.131 (0.125 to 0.136) | 0.131 (0.124 to 0.138) | 0.120 (0.114 to 0.125) | 0.126 (0.120 to 0.131) | 0.005 | 1.039 |
| 2014 | 0.179 (0.178 to 0.181) | 0.174 (0.172 to 0.176) | 0.155 (0.154 to 0.157) | 0.167 (0.165 to 0.169) | 0.013 | 1.076 | |
| Central African Republic | 2000 | 0.269 (0.258 to 0.280) | 0.263 (0.251 to 0.275) | 0.256 (0.243 to 0.269) | 0.234 (0.223 to 0.244) | 0.036 | 1.152 |
| 2010 | 0.314 (0.313 to 0.316) | 0.295 (0.293 to 0.297) | 0.282 (0.280 to 0.284) | 0.277 (0.274 to 0.279) | 0.038 | 1.136 | |
| Chad | 1996 | 0.130 (0.129 to 0.131) | 0.129 (0.127 to 0.130) | 0.130 (0.128 to 0.132) | |||
| 2014 | 0.116 (0.115 to 0.117) | 0.114 (0.113 to 0.115) | 0.119 (0.117 to 0.120) | 0.114 (0.113 to 0.115) | 0.002 | 1.014 | |
| Congo | 2005 | 0.099 (0.096 to 0.102) | 0.078 (0.076 to 0.080) | 0.073 (0.070 to 0.075) | 0.074 (0.072 to 0.076) | 0.025 | 1.332 |
| 2014 | 0.155 (0.153 to 0.156) | 0.133 (0.132 to 0.135) | 0.129 (0.128 to 0.131) | 0.129 (0.127 to 0.131) | 0.026 | 1.201 | |
| Congo Democratic Republic | 2001 | 0.190 (0.173 to 0.206) | 0.227 (0.211 to 0.244) | 0.222 (0.209 to 0.236) | |||
| 2013 | 0.136 (0.135 to 0.137) | 0.147 (0.146 to 0.149) | 0.156 (0.153 to 0.158) | 0.106 (0.104 to 0.108) | 0.030 | 1.283 | |
| Cote d'Ivoire | 1998 | 0.177 (0.173 to 0.181) | 0.187 (0.183 to 0.190) | 0.166 (0.161 to 0.171) | 0.160 (0.156 to 0.164) | 0.017 | 1.108 |
| 2016 | 0.081 (0.080 to 0.083) | 0.091 (0.090 to 0.093) | 0.071 (0.069 to 0.072) | 0.067 (0.065 to 0.069) | 0.015 | 1.220 | |
| Gabon | 2000 | 0.136 (0.134 to 0.138) | 0.126 (0.122 to 0.130) | 0.162 (0.159 to 0.166) | 0.147 (0.142 to 0.151) | -0.011 | 0.928 |
| 2012 | 0.165 (0.161 to 0.168) | 0.153 (0.150 to 0.156) | 0.182 (0.176 to 0.188) | 0.170 (0.165 to 0.174) | -0.005 | 0.970 | |
| Gambia | 2000 | 0.115 (0.102 to 0.128) | 0.114 (0.102 to 0.127) | 0.106 (0.093 to 0.119) | 0.104 (0.091 to 0.118) | 0.011 | 1.105 |
| 2013 | 0.087 (0.085 to 0.088) | 0.094 (0.092 to 0.096) | 0.079 (0.077 to 0.081) | 0.093 (0.090 to 0.095) | -0.006 | 0.934 | |
| Ghana | 1998 | 0.147 (0.146 to 0.148) | 0.145 (0.143 to 0.146) | 0.142 (0.140 to 0.144) | 0.122 (0.120 to 0.124) | 0.025 | 1.205 |
| 2014 | 0.079 (0.078 to 0.080) | 0.074 (0.073 to 0.075) | 0.072 (0.069 to 0.074) | 0.050 (0.048 to 0.051) | 0.029 | 1.594 | |
| Guinea | 1999 | 0.174 (0.172 to 0.175) | 0.166 (0.165 to 0.168) | 0.163 (0.162 to 0.165) | 0.151 (0.150 to 0.153) | 0.022 | 1.148 |
| 2016 | 0.088 (0.087 to 0.089) | 0.080 (0.078 to 0.081) | 0.077 (0.076 to 0.078) | 0.064 (0.062 to 0.066) | 0.024 | 1.373 | |
| Guinea-Bissau | 2006 | 0.075 (0.074 to 0.076) | 0.055 (0.053 to 0.057) | 0.072 (0.069 to 0.075) | 0.094 (0.091 to 0.097) | -0.019 | 0.794 |
| 2014 | 0.057 (0.056 to 0.058) | 0.043 (0.041 to 0.045) | 0.064 (0.062 to 0.067) | 0.082 (0.079 to 0.085) | -0.025 | 0.696 | |
| Liberia | 2006 | 0.142 (0.140 to 0.144) | 0.130 (0.127 to 0.134) | 0.126 (0.122 to 0.130) | 0.119 (0.114 to 0.124) | 0.023 | 1.191 |
| 2013 | 0.131 (0.129 to 0.134) | 0.111 (0.107 to 0.114) | 0.104 (0.100 to 0.108) | 0.109 (0.106 to 0.112) | 0.022 | 1.203 | |
| Mali | 1995 | 0.096 (0.093 to 0.099) | 0.096 (0.093 to 0.099) | 0.099 (0.096 to 0.102) | 0.098 (0.095 to 0.101) | -0.002 | 0.978 |
| 2015 | 0.055 (0.055 to 0.055) | 0.055 (0.054 to 0.055) | 0.058 (0.057 to 0.058) | 0.057 (0.057 to 0.058) | -0.002 | 0.962 | |
| Mauritania | 2007 | 0.087 (0.087 to 0.088) | 0.090 (0.089 to 0.091) | 0.099 (0.098 to 0.100) | 0.108 (0.107 to 0.110) | -0.021 | 0.806 |
| 2015 | 0.063 (0.062 to 0.063) | 0.064 (0.063 to 0.065) | 0.074 (0.073 to 0.075) | 0.083 (0.081 to 0.084) | -0.020 | 0.756 | |
| Niger | 1998 | 0.090 (0.088 to 0.093) | 0.108 (0.105 to 0.111) | 0.092 (0.089 to 0.094) | |||
| 2012 | 0.073 (0.072 to 0.074) | 0.071 (0.070 to 0.072) | 0.097 (0.096 to 0.098) | 0.079 (0.078 to 0.080) | -0.006 | 0.923 | |
| Nigeria | 1999 | 0.073 (0.071 to 0.076) | 0.074 (0.071 to 0.077) | 0.063 (0.061 to 0.066) | 0.056 (0.053 to 0.059) | 0.017 | 1.312 |
| 2013 | 0.053 (0.052 to 0.053) | 0.049 (0.049 to 0.050) | 0.026 (0.025 to 0.026) | 0.018 (0.017 to 0.018) | 0.035 | 2.957 | |
| Sao Tome and Principe | 2000 | 0.163 (0.143 to 0.183) | 0.182 (0.159 to 0.206) | 0.155 (0.135 to 0.176) | 0.143 (0.118 to 0.168) | 0.020 | 1.140 |
| 2014 | 0.253 (0.250 to 0.257) | 0.259 (0.255 to 0.263) | 0.251 (0.246 to 0.255) | 0.236 (0.232 to 0.240) | 0.017 | 1.074 | |
| Senegal | 2000 | 0.182 (0.174 to 0.191) | 0.174 (0.164 to 0.185) | 0.158 (0.145 to 0.171) | 0.154 (0.133 to 0.175) | 0.028 | 1.185 |
| 2017 | 0.068 (0.067 to 0.068) | 0.070 (0.069 to 0.071) | 0.090 (0.088 to 0.092) | 0.085 (0.083 to 0.087) | -0.017 | 0.795 | |
| Sierra Leone | 2000 | 0.199 (0.184 to 0.215) | 0.204 (0.190 to 0.218) | 0.181 (0.163 to 0.198) | 0.177 (0.160 to 0.194) | 0.022 | 1.125 |
| 2017 | 0.060 (0.059 to 0.060) | 0.064 (0.063 to 0.065) | 0.058 (0.057 to 0.059) | 0.035 (0.034 to 0.037) | 0.024 | 1.685 | |
| Togo | 1998 | 0.137 (0.133 to 0.140) | 0.121 (0.117 to 0.124) | 0.125 (0.119 to 0.132) | 0.122 (0.117 to 0.127) | 0.015 | 1.122 |
| 2013 | 0.160 (0.159 to 0.161) | 0.139 (0.137 to 0.140) | 0.141 (0.139 to 0.143) | 0.135 (0.134 to 0.137) | 0.025 | 1.184 |
*Note: Predicted prevalence of ARI across wealth quartiles for each country in the first and most recent survey. Predicted prevalence is calculated from a country-specific regression of disease on wealth controlling for child’s gender and age in years, mother’s age at birth of the child, mother’s educational level, location of the household (rural/urban), and survey-year fixed effects. 95% confidence intervals in parentheses. Column “Diff” contains the percentage point difference between the predicted prevalence in the poorest and richest wealth quartile. Column “Ratio” contains the ratio of the predicted prevalence rate in the poorest to that in the richest quartile (prevalence WQ1 / prevalence WQ4). ARI – acute respiratory infections.
| Year | WQ 1 | WQ 2 | WQ 3 | WQ 4 | Diff | Ratio | |
|---|---|---|---|---|---|---|---|
| Benin | 1996 | 0.341 (0.331 to 0.352) | 0.352 (0.339 to 0.364) | 0.335 (0.321 to 0.349) | 0.301 (0.284 to 0.318) | 0.040 | 1.133 |
| 2017 | 0.210 (0.209 to 0.212) | 0.218 (0.216 to 0.220) | 0.205 (0.203 to 0.207) | 0.158 (0.156 to 0.160) | 0.052 | 1.328 | |
| Burkina Faso | 1998 | 0.370 (0.367 to 0.373) | 0.368 (0.365 to 0.371) | 0.370 (0.367 to 0.374) | 0.359 (0.355 to 0.363) | 0.011 | 1.031 |
| 2010 | 0.212 (0.210 to 0.214) | 0.210 (0.208 to 0.212) | 0.213 (0.211 to 0.214) | 0.203 (0.200 to 0.205) | 0.009 | 1.046 | |
| Cameroon | 1998 | 0.190 (0.182 to 0.199) | 0.202 (0.191 to 0.213) | 0.197 (0.188 to 0.205) | 0.185 (0.177 to 0.193) | 0.005 | 1.028 |
| 2014 | 0.256 (0.254 to 0.259) | 0.269 (0.267 to 0.272) | 0.249 (0.246 to 0.252) | 0.239 (0.237 to 0.242) | 0.017 | 1.071 | |
| Central African Republic | 2000 | 0.331 (0.329 to 0.334) | 0.311 (0.309 to 0.314) | 0.311 (0.306 to 0.316) | 0.316 (0.314 to 0.319) | 0.015 | 1.048 |
| 2010 | 0.335 (0.333 to 0.337) | 0.312 (0.309 to 0.314) | 0.314 (0.311 to 0.316) | 0.323 (0.320 to 0.325) | 0.012 | 1.038 | |
| Chad | 1996 | 0.327 (0.324 to 0.331) | 0.311 (0.307 to 0.316) | 0.343 (0.338 to 0.348) | |||
| 2014 | 0.238 (0.235 to 0.242) | 0.249 (0.246 to 0.252) | 0.238 (0.234 to 0.241) | 0.249 (0.246 to 0.252) | -0.011 | 0.956 | |
| Congo | 2005 | 0.264 (0.261 to 0.267) | 0.233 (0.230 to 0.236) | 0.245 (0.242 to 0.248) | 0.226 (0.222 to 0.229) | 0.039 | 1.172 |
| 2014 | 0.321 (0.319 to 0.323) | 0.289 (0.287 to 0.291) | 0.304 (0.301 to 0.306) | 0.285 (0.281 to 0.288) | 0.036 | 1.127 | |
| Congo Democratic Republic | 2001 | 0.389 (0.384 to 0.394) | 0.418 (0.415 to 0.421) | 0.419 (0.418 to 0.421) | |||
| 2013 | 0.307 (0.305 to 0.309) | 0.318 (0.316 to 0.320) | 0.317 (0.315 to 0.319) | 0.271 (0.269 to 0.274) | 0.036 | 1.131 | |
| Cote d'Ivoire | 1998 | 0.389 (0.382 to 0.396) | 0.404 (0.398 to 0.411) | 0.363 (0.352 to 0.374) | 0.358 (0.350 to 0.365) | 0.031 | 1.088 |
| 2016 | 0.278 (0.276 to 0.280) | 0.294 (0.291 to 0.296) | 0.256 (0.253 to 0.258) | 0.243 (0.239 to 0.247) | 0.035 | 1.142 | |
| Gabon | 2000 | 0.313 (0.308 to 0.317) | 0.307 (0.301 to 0.312) | 0.334 (0.328 to 0.340) | 0.316 (0.311 to 0.322) | -0.004 | 0.988 |
| 2012 | 0.254 (0.249 to 0.259) | 0.244 (0.241 to 0.248) | 0.260 (0.252 to 0.268) | 0.249 (0.243 to 0.256) | 0.004 | 1.017 | |
| Gambia | 2000 | 0.143 (0.141 to 0.145) | 0.149 (0.147 to 0.150) | 0.139 (0.137 to 0.141) | 0.148 (0.145 to 0.150) | -0.005 | 0.969 |
| 2013 | 0.119 (0.118 to 0.120) | 0.123 (0.122 to 0.125) | 0.117 (0.116 to 0.118) | 0.124 (0.122 to 0.126) | -0.005 | 0.958 | |
| Ghana | 1998 | 0.293 (0.291 to 0.296) | 0.281 (0.278 to 0.285) | 0.272 (0.268 to 0.277) | 0.236 (0.232 to 0.240) | 0.058 | 1.245 |
| 2014 | 0.165 (0.163 to 0.167) | 0.145 (0.142 to 0.148) | 0.139 (0.135 to 0.142) | 0.100 (0.096 to 0.104) | 0.065 | 1.654 | |
| Guinea | 1999 | 0.452 (0.448 to 0.457) | 0.445 (0.440 to 0.449) | 0.430 (0.425 to 0.436) | 0.393 (0.388 to 0.399) | 0.059 | 1.150 |
| 2016 | 0.216 (0.213 to 0.219) | 0.203 (0.200 to 0.206) | 0.190 (0.186 to 0.193) | 0.150 (0.145 to 0.154) | 0.067 | 1.446 | |
| Guinea-Bissau | 2006 | 0.128 (0.126 to 0.130) | 0.116 (0.113 to 0.119) | 0.140 (0.135 to 0.145) | 0.154 (0.150 to 0.158) | -0.026 | 0.829 |
| 2014 | 0.149 (0.147 to 0.151) | 0.145 (0.142 to 0.147) | 0.171 (0.167 to 0.174) | 0.179 (0.176 to 0.182) | -0.030 | 0.834 | |
| Liberia | 2006 | 0.318 (0.313 to 0.323) | 0.331 (0.326 to 0.337) | 0.355 (0.351 to 0.358) | 0.325 (0.319 to 0.330) | -0.007 | 0.980 |
| 2013 | 0.289 (0.287 to 0.292) | 0.297 (0.294 to 0.300) | 0.317 (0.312 to 0.322) | 0.289 (0.283 to 0.295) | -0.000 | 1.000 | |
| Mali | 1995 | 0.251 (0.244 to 0.258) | 0.251 (0.243 to 0.259) | 0.253 (0.245 to 0.260) | 0.233 (0.226 to 0.239) | 0.019 | 1.080 |
| 2015 | 0.161 (0.160 to 0.162) | 0.159 (0.158 to 0.161) | 0.156 (0.155 to 0.157) | 0.127 (0.126 to 0.129) | 0.034 | 1.265 | |
| Mauritania | 2007 | 0.181 (0.179 to 0.182) | 0.170 (0.168 to 0.171) | 0.160 (0.158 to 0.161) | 0.161 (0.159 to 0.162) | 0.020 | 1.125 |
| 2015 | 0.207 (0.206 to 0.209) | 0.197 (0.195 to 0.198) | 0.184 (0.183 to 0.186) | 0.183 (0.181 to 0.186) | 0.024 | 1.131 | |
| Niger | 1998 | 0.339 (0.330 to 0.347) | 0.331 (0.323 to 0.340) | 0.285 (0.277 to 0.294) | |||
| 2012 | 0.167 (0.166 to 0.169) | 0.153 (0.151 to 0.154) | 0.154 (0.151 to 0.156) | 0.108 (0.104 to 0.111) | 0.060 | 1.556 | |
| Nigeria | 1999 | 0.194 (0.187 to 0.201) | 0.189 (0.181 to 0.198) | 0.189 (0.183 to 0.196) | 0.157 (0.149 to 0.165) | 0.037 | 1.233 |
| 2013 | 0.155 (0.154 to 0.157) | 0.138 (0.136 to 0.139) | 0.119 (0.118 to 0.121) | 0.078 (0.077 to 0.080) | 0.077 | 1.981 | |
| Sao Tome and Principe | 2000 | 0.266 (0.258 to 0.274) | 0.276 (0.267 to 0.285) | 0.258 (0.250 to 0.265) | 0.261 (0.251 to 0.272) | 0.004 | 1.017 |
| 2014 | 0.274 (0.266 to 0.281) | 0.269 (0.263 to 0.275) | 0.258 (0.250 to 0.265) | 0.279 (0.270 to 0.287) | -0.005 | 0.982 | |
| Senegal | 2000 | 0.207 (0.201 to 0.212) | 0.197 (0.191 to 0.202) | 0.212 (0.206 to 0.217) | 0.201 (0.195 to 0.206) | 0.006 | 1.030 |
| 2017 | 0.213 (0.212 to 0.214) | 0.194 (0.192 to 0.196) | 0.209 (0.206 to 0.212) | 0.198 (0.195 to 0.201) | 0.015 | 1.077 | |
| Sierra Leone | 2000 | 0.468 (0.463 to 0.472) | 0.489 (0.486 to 0.493) | 0.478 (0.474 to 0.481) | 0.474 (0.465 to 0.482) | -0.006 | 0.987 |
| 2017 | 0.202 (0.200 to 0.203) | 0.219 (0.217 to 0.220) | 0.210 (0.208 to 0.211) | 0.204 (0.202 to 0.206) | -0.003 | 0.987 | |
| Togo | 1998 | 0.260 (0.253 to 0.267) | 0.241 (0.233 to 0.249) | 0.223 (0.211 to 0.236) | 0.196 (0.187 to 0.204) | 0.064 | 1.329 |
| 2013 | 0.265 (0.263 to 0.267) | 0.241 (0.238 to 0.243) | 0.203 (0.200 to 0.206) | 0.155 (0.153 to 0.158) | 0.110 | 1.705 |
*Note: Predicted prevalence of fever across wealth quartiles for each country in the first and most recent survey. Predicted prevalence is calculated from a country-specific regression of disease on wealth controlling for child’s gender and age in years, mother’s age at birth of the child, mother’s educational level, location of the household (rural/urban), and survey-year fixed effects. 95% confidence intervals in parentheses. Column “Diff” contains the percentage point difference between the predicted prevalence in the poorest and richest wealth quartile. Column “Ratio” contains the ratio of the predicted prevalence rate in the poorest to that in the richest quartile (prevalence WQ1 / prevalence WQ4).
| Year | WQ 1 | WQ 2 | WQ 3 | WQ 4 | Diff | Ratio | |
|---|---|---|---|---|---|---|---|
| Benin | 2017 | 0.206 (0.193 to 0.218) | 0.187 (0.177 to 0.197) | 0.154 (0.145 to 0.164) | 0.074 (0.069 to 0.080) | 0.131 | 2.763 |
| Burkina Faso | 2010 | 0.355 (0.338 to 0.372) | 0.359 (0.341 to 0.377) | 0.327 (0.309 to 0.345) | 0.243 (0.227 to 0.260) | 0.111 | 1.457 |
| Congo Democratic Republic | 2013 | 0.165 (0.159 to 0.171) | 0.146 (0.137 to 0.155) | 0.123 (0.114 to 0.132) | 0.076 (0.069 to 0.082) | 0.089 | 2.183 |
| Gambia | 2013 | 0.009 (0.008 to 0.010) | 0.012 (0.010 to 0.014) | 0.006 (0.005 to 0.008) | 0.005 (0.004 to 0.006) | 0.004 | 1.796 |
| Ghana | 2014 | 0.269 (0.252 to 0.286) | 0.177 (0.157 to 0.196) | 0.108 (0.094 to 0.122) | 0.008 (0.001 to 0.015) | 0.261 | 34.136 |
| Senegal | 2017 | 0.024 (0.024 to 0.025) | 0.005 (0.004 to 0.005) | -0.001 (-0.001 to 0.000) | -0.002 (-0.003 to 0.002) | 0.026 | -11.710 |
| Togo | 2013 | 0.249 (0.234 to 0.263) | 0.205 (0.189 to 0.222) | 0.127 (0.114 to 0.140) | 0.047 (0.038 to 0.055) | 0.202 | 5.339 |
*Note: Predicted prevalence of malaria across wealth quartiles for each country in the most recent survey. Predicted prevalence is calculated from a country-specific regression of disease on wealth controlling for child’s gender and age in years, mother’s age at birth of the child, mother’s educational level, location of the household (rural/urban), and survey-year fixed effects. 95% confidence intervals in parentheses. Column “Diff” contains the percentage point difference between the predicted prevalence in the poorest and richest wealth quartile. Column “Ratio” contains the ratio of the predicted prevalence rate in the poorest to that in the richest quartile (prevalence WQ1 / prevalence WQ4).
For the most recent survey, the predicted prevalence rate of diarrhoea among children from the poorest quartile ranges from 8.7% in Sierra Leone to 26.2% in Cameroon. For children from the richest quartile it ranges from 5.6% in Nigeria to 23.8% in the Central African Republic. From the first to the most recent survey, the prevalence of diarrhoea increased by about 10 percentage points in the poorest wealth quartile in Cameroon and declined by about 18 percentage points for all quartiles in Sierra Leone.
The predicted prevalence rate of ARI in the most recent period ranges from 4.4% in Burkina Faso to 31.4% in the Central African Republic for the first quartile and from 1.8% in Nigeria to 27.7% also in the Central African Republic for children from the fourth quartile. The prevalence increased over time by 9.6 percentage points in the third quartile in Sao Tome and Principe and decreased by 14.2 percentage points for children of the richest quartile in Sierra Leone.
The highest prevalence of fever is observed in the Central African Republic with 33.5% for the poorest and 32.3% for the richest quartile, the lowest in Gambia with 11.9% and Nigeria with 7.8% for children from the poorest and the richest quartile respectively. The change in the prevalence over time ranges from a just above 5 percentage point increase in the richest quartile in Cameroon to around 27 percentage point decrease for all quartiles in Sierra Leone.
The broadest range is observed for the prevalence of malaria from 0.9% in Gambia to 35.5% in Burkina Faso for children from the first quartile and 0 to 24.3% for children from the fourth quartile in the same countries.
We express the wealth gradient with two different indicators shown in Tables 1 to 4 Table 2 Table 3 Table 4. Column 6 contains the wealth gradient in terms of the percentage point difference in prevalence between the poorest and the richest quartile. Column 7 shows the ratio of the prevalence rate in the poorest to that in the richest quartile, accounting for the level of the prevalence.
For diarrhoea, the gradient in the recent period is largest in Nigeria with a percentage point difference of 9.5 and a ratio of 2.7. Guinea-Bissau, Burkina Faso and the Democratic Republic of Congo show a negative gradient. Nigeria also has the biggest ratio for the prevalence of ARI, with children from poorer households being almost 3 times more likely to suffer from acute respiratory disease than children from the richest quartile. The Central African Republic has the largest percentage point difference with 3.8 percentage points. Similarly, Nigeria has the largest gradient for the prevalence of fever with a ratio of almost 2. In Togo, the percentage point difference is largest with children from the poorest quartile having a 11 percentage point higher likelihood of suffering from fever compared to children from the richest wealth quartile. Ghana has the biggest gradient for malaria with a difference of 26 percentage points and a ratio of 34, an extreme case of a wealth gradient.
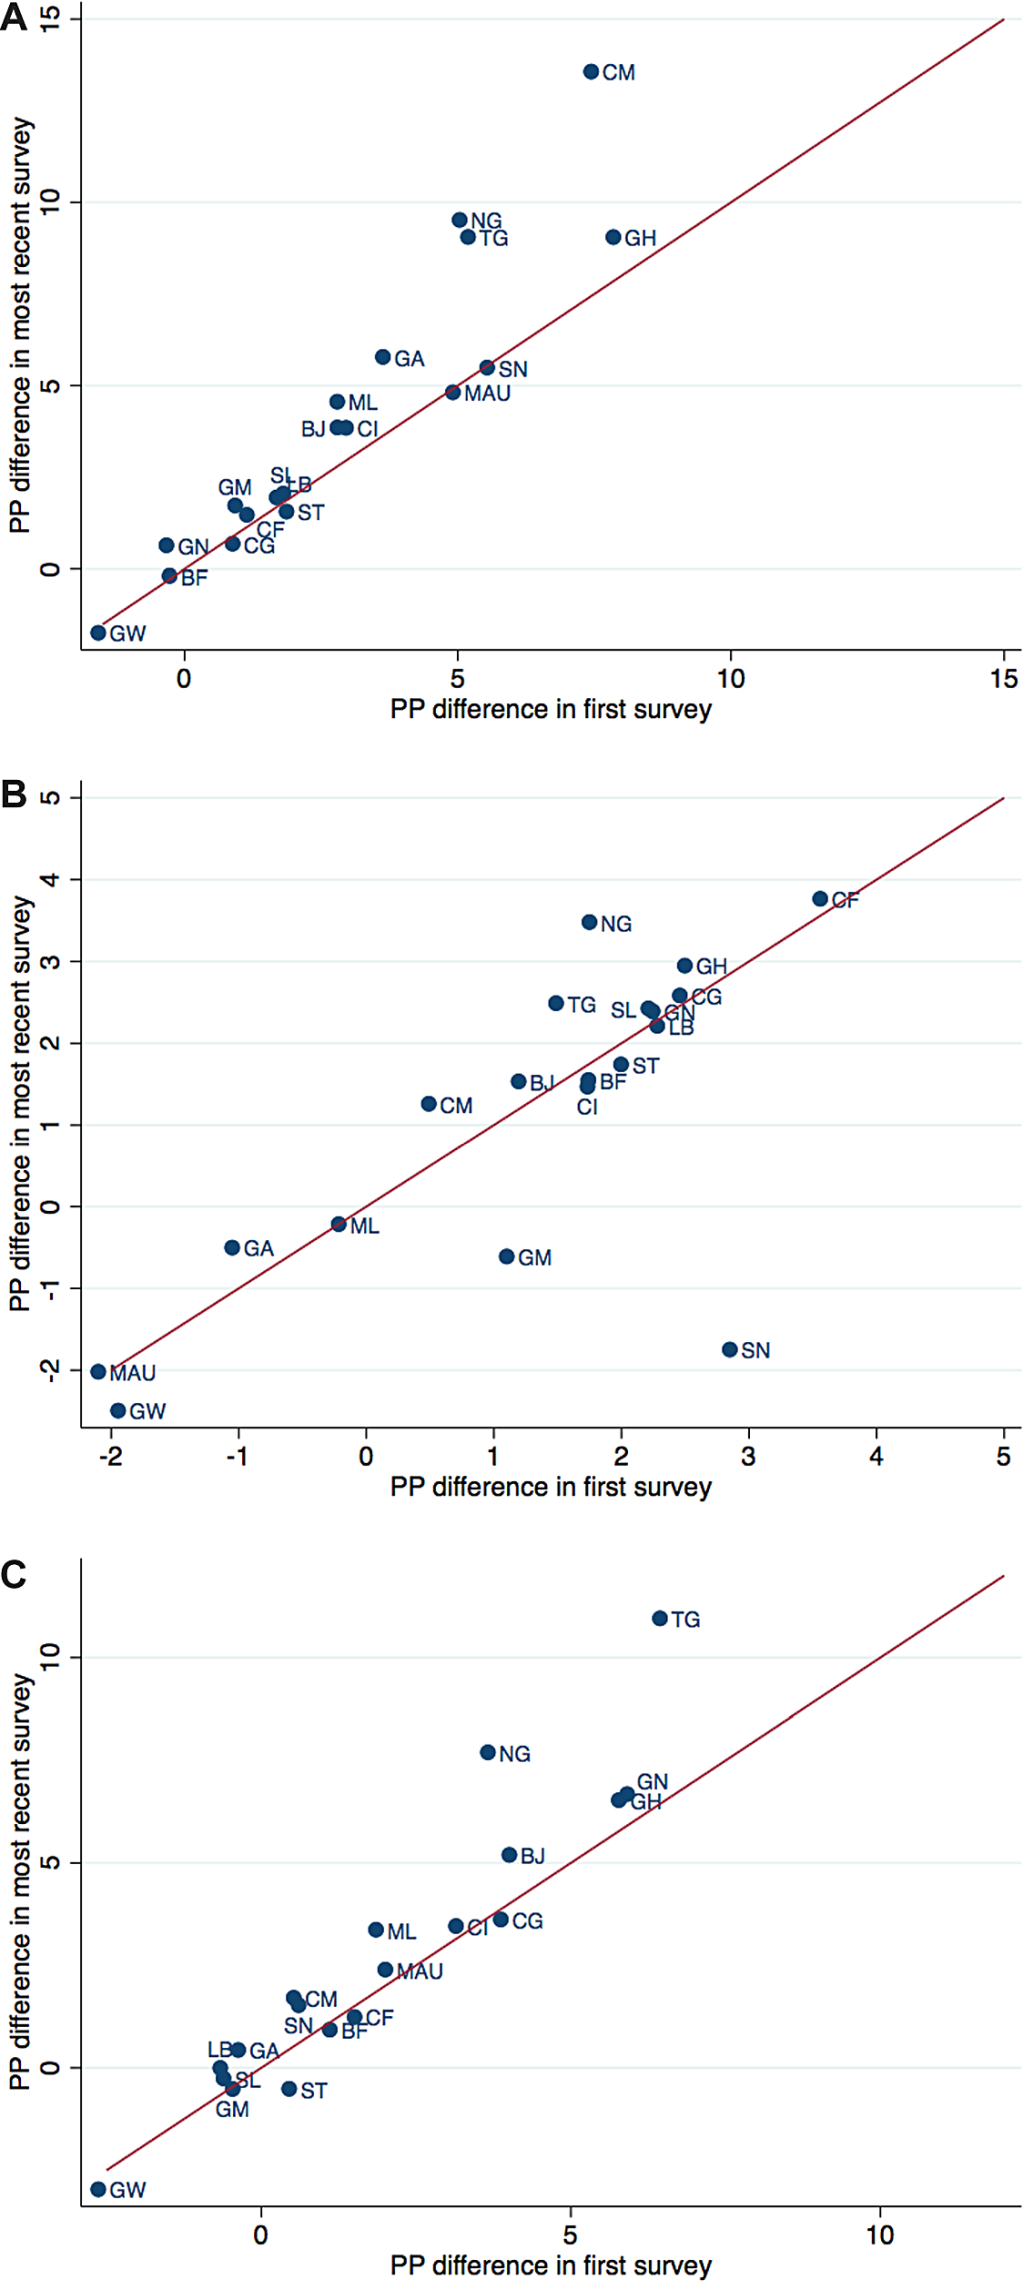
The percentage point differences between the predicted prevalence of the poorest and the richest quartile in different countries and their change from the first to the last survey are illustrated in Figure 3 , Panels A-C. The difference between the poorest and the richest quartile in the earliest survey is plotted on the horizontal axis and the difference in the most recent survey on the vertical axis. For countries located above the 45-degree line, the difference between the riches and the poorest quartile increased over time, for those below it decreased. The distance to the line indicates the magnitude of the change. Figure 4 , Panels A-C are similar to Figure 3 , Panels A-C, but use the ratio of the prevalence in the poorest to those in the richest quartile instead of the difference, thereby accounting for the level of the prevalence. Country abbreviations are listed in Table 5 .
| Country name | Country code |
|---|---|
| Burkina Faso | BF |
| Benin | BJ |
| Congo Democratic Republic | CD |
| Central African Republic | CF |
| Congo | CG |
| Cote d'Ivoire | CI |
| Cameroon | CM |
| Equatorial Guinea | EQG |
| Gabon | GA |
| Ghana | GH |
| Gambia | GM |
| Guinea | GN |
| Guinea-Bissau | GW |
| Liberia | LB |
| Mauritania | MAU |
| Mali | ML |
| Nigeria | NG |
| Niger | NI |
| Sierra Leone | SL |
| Senegal | SN |
| Sao Tome and Principe | ST |
| Chad | TD |
| Togo | TG |
In most countries, the wealth gradient of diarrhoea prevalence increased over time. The largest increase in terms of difference in percentage points occurred in Cameroon, Nigeria and Togo, and in terms of the ratio in Nigeria, Ghana and Togo. While some countries show a decline in the gradient of ARI, for the majority of countries it has grown over the years. The largest increase in the difference occurred in Nigeria, the largest decrease in Senegal and Gambia. The wealth gradient for the prevalence of fever amplified for most countries over time. Nigeria and Togo show a very large rise both in the difference as well as in the ratio. For Ghana with low overall prevalence of fever, the difference has not increased largely but the ratio did. All countries with a decreasing gap show only smaller changes.
In this study, we analysed the change over time in the association between wealth status and childhood diseases for Western and Central African countries between 1995 and 2017. The predicted prevalence of each disease can be compared with the mean prevalence for the region [10 ].
Our results suggest a notable wealth gradient in the prevalence rates of diarrhoea, ARI, malaria, and fever. Children in the poorest 25 percent of households are much more often sick with diarrhoea, ARI, or malaria than children in the richest 25 percent. This is consistent with the findings of Kahabuka et al. in Tanzania [15]. While important reductions in prevalence rates have been achieved in the region, progress is slowing down. Moreover, these reductions have been unequally distributed. Overall, children in richer households have seen larger reductions in disease prevalence than children in poorer households, leading to an increasing wealth gradient. Despite substantial variation, this holds true for almost all countries included in our analysis. Looking at the prevalence of diarrhoea, 14 out of 22 countries have experienced a widening of the wealth gap measured both by the percentage point difference and the ratio between the poorest and wealthiest quartiles. A reduction in both indicators was found only for Congo and Sao Tome and Principe. The picture is only slightly better for the wealth gap in the prevalence of ARI. This finding might indicate that household wealth is becoming a more important risk factor for childhood diseases especially in the poorest households.
Programmes that have driven down disease prevalence are insufficiently capable of reaching the poorest, most vulnerable households. This may be because those households are the ones most difficult to reach or the ones with multiple interlinked challenges that were not yet addressed in their entirety by previous programmes. Efforts should be increased to adapt programmes to target the poorest households. Insufficient resources and inappropriate allocation are major impediments to the delivery of effective health care that reaches the poor. Most obviously, economic resources are often insufficient to support the provision of essential services. Public expenditures on health care have to be further scaled up substantially to address this concern.
A strong focus on financing primary health care as well as preventive measures seems warranted. Diarrhoea, pneumonia as well as malaria are all easily preventable diseases. For example, effective basic sanitation and drinking water infrastructure together with initiatives promoting healthy behaviour in the communities can substantially reduce the prevalence of diarrhoea. One of the key programmes of UNICEF West and Central Africa focuses on eliminating open defecation through community behaviour change and adequate sanitation systems [22].
This study contributes to the literature by providing insights about a particularly interesting region, containing some of the countries with the highest burden of the diarrhoea, ARI, and malaria. While predicting disease prevalence for the whole region, this study adds comparable analyses for each country separately. In addition, it expands the literature with the analysis of the change in the wealth gap over time.
There are some important limitations to this study. While we create an asset index that is comparable across countries and time to capture the wealth status of households, this asset index might not be the best suited for each individual country. Ensuring comparability at the same time means reducing the adaptation to each country context. In addition, as fewer assets were recorded in earlier surveys, the asset index is less accurate for the earlier time period than for the more recent periods. Data availability therefore limits the robustness of our analysis.
Moreover, surveys that did not record information on outcomes, assets and covariates had to be dropped. This restricts the generalisability of the results to the countries and years included in this analysis. Additionally, within included surveys, observations with missing information could not be used in the estimations, potentially limiting the representativeness of the sample.
Another limitation is that our analysis does not include all possible risk factors that might be associated with the prevalence of each disease. Our set of covariates in the prediction of disease prevalence is the same for each disease. This increases comparability between the estimations. However, we might miss out on disease specific risk factors such as nutrition for diarrhoea or housing characteristics for malaria. Our focus is on wealth and its association with childhood diseases. Analysing the effect size of any particular factor in isolation from the role of others, however, might lead to an overestimation of the true effect size [23].
This study illustrates the strong association of wealth with the prevalence of childhood diseases in Western and Central African countries. It also highlights that the wealth gradient in health tends to increase rather than decrease over time, which raises concerns of increasing inequality that goes beyond wealth.
While increasing people’s wealth may impact several factors that in turn affect the prevalence of childhood diseases, this strategy is rather difficult and costly. Trying to reduce the link between wealth and childhood diseases, as well as directly aiming at reducing the prevalence of childhood diseases may be a more effective approach. In addition, households in the lowest wealth quartile might be burdened by several interlinked challenges at the same time that cannot be addressed by programmes focusing solely on disease prevention. This requires further efforts in implementing programmes that aim at improving health practices at the household and community level as well as programmes to improve housing, sanitation, and access to health services. The considerable wealth gradient suggests that targeting the poorest households and developing programmes that are adapted to their specific needs is necessary for achieving the goal of further reducing the high prevalence of childhood diseases and diminishing the stark health disparities across wealth.