China, with the largest and fastest aging population in the world, faces a significant challenge in managing age-related eye diseases which can ultimately cause visual impairment (VI) [1 -4]. According to the Global Burden of Disease Study 2017, the Disease Adjusted Life Years (DALYs) of VI among Chinese populations has an upward trend, rising from 31.52 (95% CI = 20.55, 47.29) billion in 1990 to 55.12 (95% CI = 36.47, 82.49) billion in 2017, which contributes greatly to the disease burden worldwide [5 ]. Moreover, the increased life expectancy and the population increase indicates that the prevalence of VI is yet to rise, which would result in heavy economic burden to societies and individuals [6-8].
As a contributing member of the global movement Visual 2020, China has been taking significant strides toward reducing the prevalence of VI [9]. Plenty of past epidemiologic studies have reported on VI prevalence [9,10], and there have been several meta-analyses evaluating the VI prevalence among Chinese population in the past decades [2,11,12]. However, in recent years, many new studies have been conducted, which implies that an update concerning the magnitude of VI prevalence is necessary. Also, as many of the studies reporting VI prevalence are written in Chinese, this information is not accessible to researchers worldwide to assess the current situation of VI prevalence among older Chinese populations.
Therefore, we performed this systematic review and meta-analysis to evaluate the magnitude of VI among older Chinese populations (individuals above 50 years old). Time trends and pooled prevalence of VI together with subgroup analyses by demographic characteristics in older Chinese populations will be investigated in this meta-analysis. We aim to produce results that will provide useful information for appropriate preventive strategies to reduce the disease burden caused by VI in China and beyond.
Literature search strategy
This meta-analysis was conducted according to the Preferred Reporting Items for Systematic Reviews and Meta-Analyses (PRISMA) statement. Publications reporting prevalence of VI among Chinese populations were reviewed and assessed. Two investigators (ZMJ and GDW) searched for literature independently in both English (Embase, PubMed and Web of science) and Chinese (SinoMed, VIP and Chinese National Knowledge Infrastructure) databases from January 1, 1999 until June 16, 2020. The search terms were as follows:
-
((“Vision Disorders”[Mesh]) OR “Blindness”[Mesh]) OR (“Vision, Low”[Mesh]) OR (“Visually Impaired Persons”[Mesh]) OR blindness OR visual impairment OR low vision OR visual loss OR visually impaired OR visual disability
-
(“Prevalence”[Mesh]) OR (“Epidemiology”[Mesh]) OR (prevalence OR Epidemiology OR incidence)
-
“China”[Mesh] or China or Chinese
-
Combine 1 AND 2 AND 3
Study selection
Studies were included if they met the following criteria: 1) population-based study; 2) utilized recognized definitions and standardized grading method to diagnose and classify VI; 3) accessible full text in Chinese or English; 4) explicit survey year; 5) age-specific prevalence data. Population-based studies are those which have a clear sampling frame of the community. The most common definition of VI is as follows: normal vision, visual acuity better than 6/12; moderate and severe visual impairment (MSVI), visual acuity better than 3/60 but worse than 6/18; and blindness, visual acuity worse than 3/60. One sub-lesion of VI, severe visual impairment (SVI), is defined as 3/60 to 6/60. Low vision is defined as having blindness or VI [13 ]. The prevalence by presenting visual acuity (PVA) and best corrected visual acuity (BCVA) were pooled separately.
Titles and abstracts of all initial searched results were screened independently by two investigators (ZMJ and GDW). If there was more than one publication based on the same study, the study with more thorough information was selected.
Data extraction and quality assessment
Two investigators (ZMJ and GDW) conducted the data extraction independently and any disagreements were resolved by a discussion with a third investigator (JGM). The following information was extracted and tabulated: first author, study setting, sampling method, survey time, sample size, basic demographic data, the prevalence of MSVI, SVI, VI and SVI if available. For the multicenter surveys, we used the pooled prevalence provided by the original study. If the studies did not provide pooled prevalence, the prevalence data of the single location in the study was used.
The quality of all selected articles was evaluated by two investigators (ZMJ and GDW) with a commonly used 8-item assessment tool[14,15] According to the quality evaluation tool, each study was given a score of 0-8. We consider a score of 7-8 as high quality, 4-6 as moderate quality, and 0-3 as low quality. The coding of assessment has been described previously.
Statistical analysis
The meta-analysis was conducted using the Comprehensive Meta-Analysis software, Version 2 (Biostat Inc., Englewood, New Jersey, USA). The prevalence of MSVI, SVI (if applicable), VI and blindness with 95% confidence intervals (CI) were calculated using random-effects models if considered of high heterogeneity, otherwise the fixed-effects model was applied. Heterogeneity between studies was assessed by I2 statistic, with I2>50% regarded as high heterogeneity. Age-specific pooled prevalence of MSVI and blindness by 50-59, 60-69, 70-79, 80 and above years old age groups was conducted. To explore the possible sources of heterogeneity associated with gender, district (rural/urban), geographical location (central/eastern/western China), education level (illiterate/primary school and lower/middle school and above) and survey year (1999-2009/2010-2017), subgroup analyses were performed using Q-tests separately. Continuous variables were dichotomized using median splitting method in subgroup analyses. Publication bias was assessed by the Funnel plots, Begg’s tests and Egger’s tests. Significance level was set at P < 0.05(two-tailed) [16].
Selection and inclusion of the studies
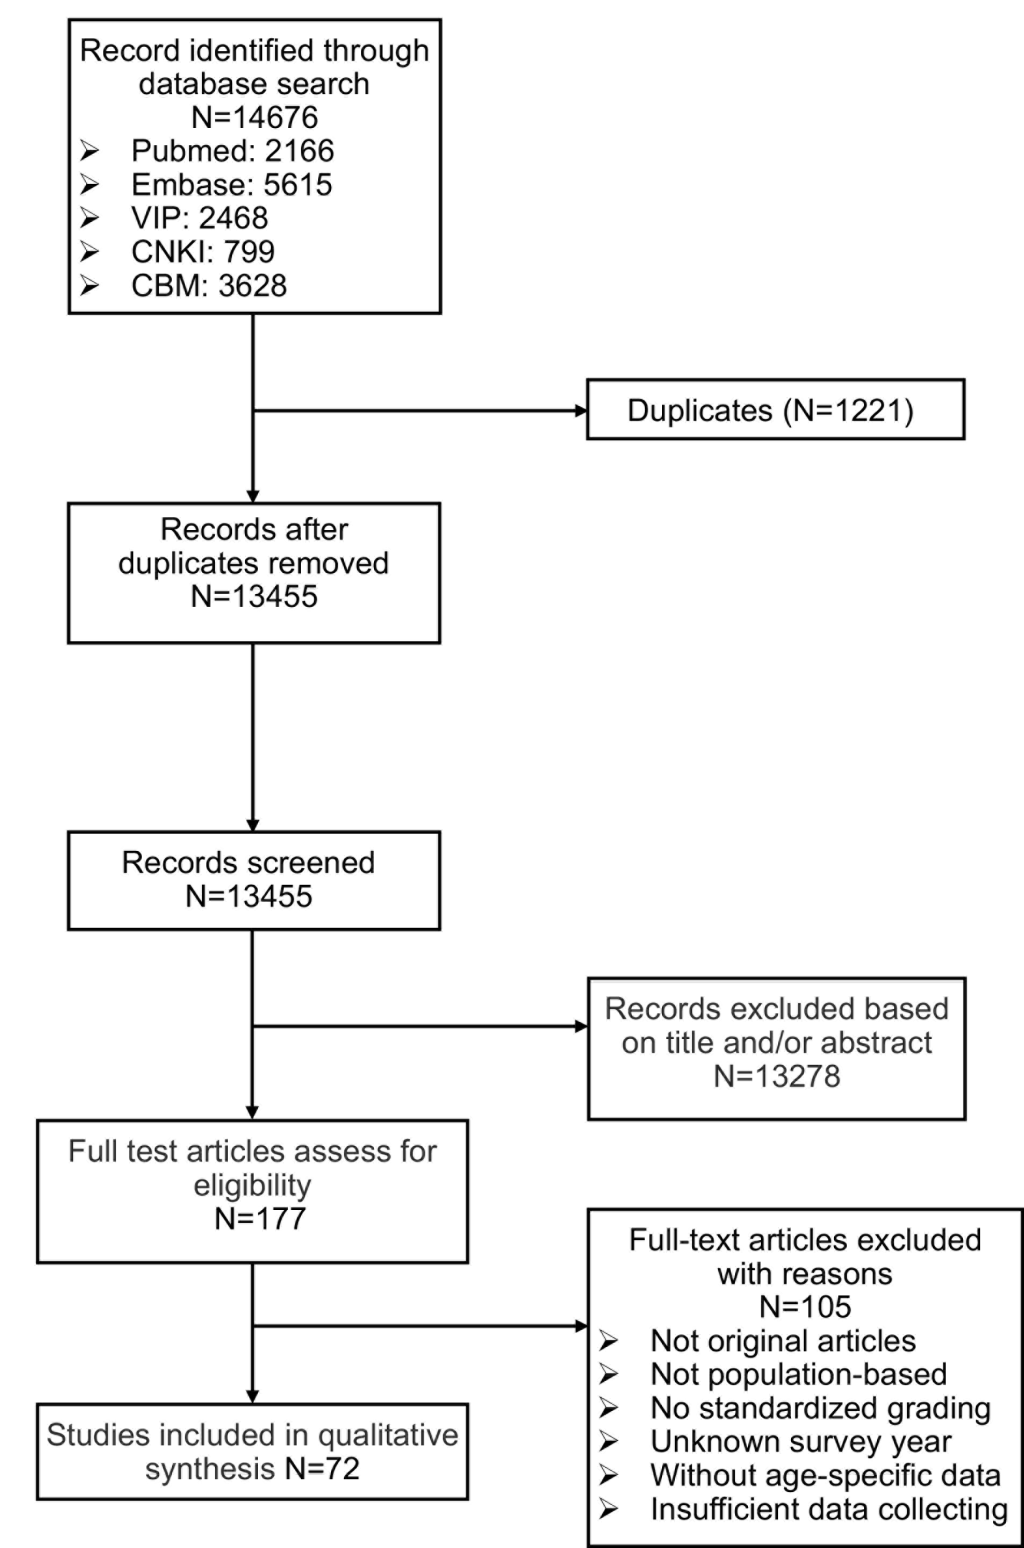
72 studies with 465 039 individuals out of 14 676 initial records were identified according to the inclusion criteria for analysis ( Figure 1 ). There were 90 data sets in total as four studies conducted multi-center surveys with different samples [9,10 ,17,18]. Basic characteristics of the included studies are given in Table 1 . Of these 72 studies, 20 were written in English [9 ,10,17,19,20,25,27-32,55,56,67-69,75,83,84] and the rest were in Chinese [18,21- 24,26,33-54,57-66,70-74,76-83,85-95]. The target population of all selected studies was clearly defined, and all the samples were representative of the general population. 38 studies used BCVA [18,28-64], 9 studies used PVA [19-27] and the rest used both BCVA and PVA [9,10,17,65 -95] in the diagnoses of blindness and MSVI. The data of several subgroup analyses (gender, district, geographical location, age, education and examined year) were not available in some included studies; the sum of the individuals may not agree with the total number given by 72 studies.
| First author | Province | District | Region | Language | Survey year | Age range | N | Measure of visual acuity | Response rate (%) | Definition of older adults | No. of older adults | Assessment* | ||||
|---|---|---|---|---|---|---|---|---|---|---|---|---|---|---|---|---|
| Emmy Y. Li [19 ] | Hainan | E | R | EANG | 2010 | ≥50 | 6482 | PVA | 95.3 | ≥50 | 6482 | 6 | ||||
| CW Pan [20 ] | Jiangsu | E | R | ENG | 2013-2014 | ≥60 | 4579 | PVA | 82.1 | ≥60 | 4579 | 6 | ||||
| JF Chen [21 ] | Shanghai | E | R & U | CHN | NA | ≥50 | 5090 | PVA | 87.8 | ≥50 | 5090 | 5 | ||||
| H Hu [22 ] | Yunnan | W | R | CHN | 2014 | ≥50 | 5592 | PVA | 93.2 | ≥50 | 5592 | 7 | ||||
| XJ Zhang [23 ] | Tianjin | E | R | CHN | 2001 | ≥40 | 1776 | PVA | 89.4 | ≥50 | 1026 | 5 | ||||
| S Liu [24 ] | Chongqing | W | U | CHN | 2005 | ≥50 | 5079 | PVA | 89.4 | ≥50 | 5079 | 6 | ||||
| L Li [25 ] | Jiangsu | E | U | ENG | 2003 | ≥60 | 3040 | PVA | 90.7 | ≥60 | 3040 | 6 | ||||
| S Wu [26 ] | Zhejiang | E | R & U | CHN | 2012-2013 | ≥60 | 3428 | PVA | 99.0 | ≥60 | 3428 | 6 | ||||
| ZJ Li [27 ] | Heilongjiang | E | R | ENG | 2006-2007 | ≥50 | 5057 | PVA | 91.0 | ≥50 | 5057 | 6 | ||||
| Nancy Chen [28 ] | Taiwan | E | R | ENG | ≥65 | 2316 | BCVA | 61.2 | ≥65 | 2316 | 6 | |||||
| T Li [29 ] | Shanxi | C | R & U | ENG | 2006 | 0-80 | 75016 | BCVA | 85.5 | ≥50 | 17473 | 6 | ||||
| Y Yao [30 ] | Jiangsu | E | U | ENG | 2010 | ≥50 | 6155 | BCVA | 91.5 | ≥50 | 6155 | 6 | ||||
| GS Zhang [31 ] | Inner Mongolia | C | R & U | ENG | 2013 | ≥40 | 5770 | BCVA | 80.1 | ≥50 | 4928 | 7 | ||||
| YG Zhang [32 ] | Heilongjiang | C | R | ENG | 2008-2009 | All | 10384 | BCVA | 88.1 | ≥50 | 2728 | 7 | ||||
| GP Duan [33 ] | Hunan | C | R | CHN | 2008-2009 | ≥50 | 4857 | BCVA | 92.3 | ≥50 | 4857 | 6 | ||||
| GP Duan [34 ] | Hunan | C | R | CHN | 2008-2009 | ≥50 | 4402 | BCVA | 88.8 | ≥50 | 4402 | 7 | ||||
| J Fu [35 ] | Xinjiang | W | R & U | CHN | 2009-2010 | ≥40 | 8295 | BCVA | 83.8 | ≥50 | 5235 | 6 | ||||
| YH Gu [18] | Anhui | C | U | CHN | 2008 | All | 3336 | BCVA | 91.4 | ≥50 | 987 | 7 | ||||
| R | 3602 | 92.1 | 1386 | |||||||||||||
| XY Huang [36 ] | Guangdong | E | R | CHN | 2012 | ≥50 | 4329 | BCVA | 93.7 | ≥50 | 4329 | 6 | ||||
| Y Huang [37 ] | Shanghai | E | R | CHN | 2016-2017 | ≥60 | 4260 | BCVA | 70.8 | ≥60 | 4260 | 6 | ||||
| JP Liu [38 ] | Yunnan | W | R | CHN | 2008 | All | 2460 | BCVA | 80.1 | ≥50 | 705 | 8 | ||||
| XP Liu [39 ] | Guangdong | E | R & U | CHN | 2014-2015 | ≥50 | 4539 | BCVA | NA | ≥50 | 4539 | 5 | ||||
| XY Ma [40 ] | Shanghai | E | U | CHN | 2009 | ≥65 | 2299 | BCVA | 92.0 | ≥65 | 2299 | 6 | ||||
| M NA Bijiang [ 41] | Xinjiang | W | U | CHN | 2010 | ≥40 | 4104 | BCVA | 81.6 | ≥50 | 2853 | 6 | ||||
| M Yusup [42 ] | Xinjiang | W | R | CHN | 2009 | ≥40 | 4191 | BCVA | 86.0 | ≥50 | 2382 | 7 | ||||
| YJ Meng [43 ] | Tianjin | E | R & U | CHN | 2014 | ≥60 | 5520 | BCVA | 94.0 | ≥60 | 5520 | 6 | ||||
| JZ Pei [44 ] | Shaanxi | W | R | CHN | 2010-2012 | All | 4394 | BCVA | 85.0 | ≥50 | 1912 | 7 | ||||
| H Qi [45 ] | Shanghai | E | U | CHN | 2009 | ≥60 | 4785 | BCVA | 91.3 | ≥60 | 4785 | 6 | ||||
| LF Qiao [46 ] | Sichuan | W | R | CHN | 2011 | ≥50 | 2817 | BCVA | 98.8 | ≥50 | 2817 | 6 | ||||
| FR Shen [47 ] | Shanxi | C | R | CHN | NA | ≥50 | 6769 | BCVA | 96.7 | ≥50 | 6769 | 6 | ||||
| B Shen [48 ] | Shanghai | E | U | CHN | 2010 | ≥60 | 6302 | BCVA | 91.8 | ≥60 | 6302 | 6 | ||||
| W Sun [49 ] | Jiangsu | E | U | CHN | 2010 | ≥50 | 6150 | BCVA | 91.5 | ≥50 | 6150 | 6 | ||||
| GM Wang [50 ] | Shandong | E | R | CHN | 2008 | ≥50 | 4916 | BCVA | 98.2 | ≥50 | 4916 | 6 | ||||
| XL Wu [51 ] | Zhejiang | E | U | CHN | 2015-2016 | ≥50 | 5448 | BCVA | 89.9 | ≥50 | 5448 | 6 | ||||
| LJ Tang [52 ] | Chongqing | W | U | CHN | 2009-2011 | ≥55 | 2600 | BCVA | NA | ≥55 | 2600 | 6 | ||||
| SS Zhang [53 ] | Jiangsu | E | U | CHN | 2013 | ≥60 | 5564 | BCVA | 94.9 | ≥60 | 5564 | 6 | ||||
| J Zhang [54 ] | Shaanxi | W | R | CHN | 2007 | ALL | 8725 | BCVA | 96.0 | ≥60 | 1284 | 5 | ||||
| XJ Zhang [55 ] | Guangdong | E | R & U | ENG | 2012 | ≥50 | 3484 | BCVA | 94.2 | ≥50 | 3484 | 8 | ||||
| L Xu [56 ] | Beijing | E | R & U | ENG | 2001 | ≥40 | 4439 | BCVA | 83.4 | ≥50 | 2987 | 7 | ||||
| L Chen [57 ] | Shaanxi | W | R | CHN | 2003 | ≥50 | 1765 | BCVA | 80.2 | ≥50 | 1765 | 6 | ||||
| CX Qi [58 ] | Guangdong | E | U | CHN | 2007 | ≥50 | 4126 | BCVA | 91.0 | ≥50 | 4126 | 6 | ||||
| LL Yang [59 ] | Guangdong | E | U | CHN | 2008 | ≥60 | 11210 | BCVA | 88.2 | ≥60 | 11210 | 6 | ||||
| M Wei [60 ] | Sichuan | W | R & U | CHN | 2006 | ALL | 125641 | BCVA | NA | ≥50 | 41441 | 5 | ||||
| XF Gao [61 ] | Heilongjiang | E | U | CHN | 1999 | ≥60 | 7499 | BCVA | 92.0 | ≥60 | 7499 | 6 | ||||
| X Zhao [62 ] | Beijing | E | U | CHN | 2006 | ≥50 | 2410 | BCVA | 85.1 | ≥50 | 2410 | 5 | ||||
| TY Xie [63 ] | Xinjiang | W | R | CHN | 2005 | ≥40 | 2955 | BCVA | 80.0 | ≥50 | 1929 | 6 | ||||
| TZ Zhang [64 ] | Xinjiang | W | R | CHN | 2001 | ≥45 | 1208 | BCVA | 91.3 | ≥55 | 736 | 5 | ||||
| J Zhou [65 ] | Jiangsu | E | R | CHN | 2008 | ≥60 | 1305 | PVA&BCVA | 93.8 | ≥60 | 1305 | 7 | ||||
| XW Tong [66 ] | Shanghai | E | U | CHN | 2009 | ≥60 | 4545 | PVA&BCVA | 87.4 | ≥60 | 4545 | 6 | ||||
| YT Tang [67 ] | Zhejiang | E | R & U | ENG | 2012-2013 | ≥45 | 10234 | PVA&BCVA | 78.1 | ≥50 | 8317 | 7 | ||||
| J Li [68 ] | Yunnan | W | R | ENG | 2010 | ≥50 | 2133 | PVA&BCVA | 77.8 | ≥50 | 2133 | 8 | ||||
| XF Li [69 ] | Hebei | E | R | ENG | 2010 | >7 | 20298 | PVA&BCVA | 82.7 | ≥50 | 4012 | 7 | ||||
| M Yang [70 ] | Jiangsu | E | R | CHN | 2010-2011 | ≥50 | 5947 | PVA&BCVA | 96.8 | ≥50 | 5947 | 7 | ||||
| MC Yi [71 ] | Sichuan | W | U | CHN | 2013 | ≥50 | 3086 | PVA&BCVA | 93.7 | ≥50 | 3086 | 7 | ||||
| JY Hu [72 ] | Jiangsu | E | R | CHN | 2006 | ≥50 | 653 | PVA&BCVA | 92.0 | ≥50 | 653 | 6 | ||||
| W Zhou [73 ] | Shanghai | E | R & U | CHN | 2015 | ≥50 | 3497 | PVA&BCVA | 86.3 | ≥50 | 3497 | 5 | ||||
| LH Wang [74 ] | Shandong | E | R | CHN | 2008 | ≥50 | 17816 | PVA&BCVA | 91.0 | ≥50 | 17816 | 8 | ||||
| SS Huang [75 ] | Guangdong | E | U | ENG | 2003 | ≥50 | 1399 | PVA&BCVA | 75.3 | ≥50 | 1399 | 8 | ||||
| BJ Hou [76 ] | Tibet | W | R | CHN | 2000 | ≥40 | 3071 | PVA&BCVA | 97.4 | ≥50 | 2060 | 6 | ||||
| JL Zhao [9 ] | Multicenter | NA | R | ENG | 2014 | ≥50 | 51310 | PVA&BCVA | 90.6 | ≥50 | 51310 | 7 | ||||
| RR Zhu [17] | Jiangsu | E | R | ENG | 2010 | ≥50 | 5947 | PVA&BCVA | 96.8 | ≥50 | 5947 | 7 | ||||
| U | 6106 | 90.8 | 6106 | |||||||||||||
| W Wang [77 ] | Shanghai | E | R | CHN | 2008-2009 | ≥60 | 2150 | PVA&BCVA | 81.0 | ≥60 | 2150 | 6 | ||||
| CJ Liu [78 ] | Shanghai | E | U | CHN | 2012 | ≥70 | 15238 | PVA&BCVA | NA | ≥70 | 15238 | 4 | ||||
| LL Deng [79 ] | Jiangxi | C | R | CHN | 2015 | ≥50 | 5119 | PVA&BCVA | 94.1 | ≥50 | 5119 | 6 | ||||
| JH Zhou [80 ] | Yunnan | W | R | CHN | 2011-2012 | ≥50 | 5151 | PVA&BCVA | 92.4 | ≥50 | 5151 | 5 | ||||
| M Wu [81 ] | Yunnan | W | R | CHN | 2008 | ≥50 | 2842 | PVA&BCVA | 94.7 | ≥50 | 2842 | 5 | ||||
| JL Zhao [10 ] | Multicenter | NA | R | ENG | 2006 | ≥50 | 47547 | PVA&BCVA | 91.5 | ≥50 | 47547 | 8 | ||||
| M Wu [82 ] | Yunnan | W | R & U | CHN | 2006 | ≥50 | 2588 | PVA&BCVA | 93.8 | ≥50 | 2588 | 5 | ||||
| XB Huang [83 ] | Shanghai | E | U | CHN | 2007-2008 | ≥60 | 3851 | PVA&BCVA | 92.7 | ≥60 | 3851 | 6 | ||||
| WL Song [84 ] | Heilongjiang | E | R | ENG | 2007 | ≥40 | 4956 | PVA&BCVA | 86.0 | ≥50 | 3525 | 6 | ||||
| XJ Xiong [85 ] | Chongqing | W | R | CHN | NA | ≥50 | 2122 | PVA&BCVA | 83.0 | ≥50 | 2122 | 7 | ||||
| YB Liang [86 ] | Hebei | E | R | ENG | 2006-2007 | ≥30 | 6830 | PVA&BCVA | 90.4 | ≥50 | 4241 | 8 | ||||
Quality assessment and publication bias
The 8-item assessment tool was used to evaluate the quality of the included studies, ranging from 4 to 8, with an average assessment score of 6.2. 7 studies were given the highest score [10,38,55,68,74,75,86], and 23 studies were classified as high quality, while the rest were considered moderate quality. The most common problem of the included studies in the meta-analysis was unclear description of non-responders.
After removing each study sequentially for sensitivity analysis, the pooled prevalence of remaining studies did not change significantly compared to the initial results. According to the results of the Begg’s test (MSVI: Z = 1.524, P = 0.127; blindness: Z = 1.676, P = 0.094), Egger’s tests (MSVI: t = 0.547, P = 0.588; blindness: t = 0.648, P = 0.521) and funnel plot (Figure S1 in the Online Supplementary Document , Panels A and B), we concluded that there was no publication bias in both the prevalence of blindness and MSVI by PVA. Concerning the prevalence of blindness and MSVI by BCVA, although the Begg’s tests indicated potential bias may exist (MSVI: Z = 2.940, P = 0.003; blindness: Z = 2.525, P = 0.012), the Egger’s tests (MSVI: t = 0.878, P = 0.383; blindness: t = 1.305, P = 0.197) and funnel plot (Figure S1 in the Online Supplementary Document , Panels C and D) did not suggest any publication bias.
Prevalence of blindness and VI among Chinese population by using PVA
The pooled prevalence using PVA is given by Table 2 and Figure S1 in the Online Supplementary Document (Panels E and F), with 250 080 individuals in total. MSVI prevalence reported in original studies varied from 1.8% to 43.7%[9,25], while blindness was 0.3% to 10.6%[21,76]. The pooled prevalence of MSVI was 10.9% (95% CI = 9.4%-12.6%) and blindness was 2.2% (95% CI = 1.8%-2.8%). As for SVI and VI, the pooled rate was 2.7% (95% CI = 1.9%-3.8%) and 13.6% (95% CI = 11.8%-15.6%).
| First author | No. of older adults | Presenting visual acuity | |||
|---|---|---|---|---|---|
| MSVI | SVI | VI | Blindness | ||
| Emmy Y. Li [19] | 6482 | 11.8 (11.0-12.6) | 1.9 (1.6-2.2) | 16.2 (15.3-17.1) | 4.4 (3.9-4.9) |
| CW Pan [20 ] | 4579 | 6.3 (5.6-7.0) | – | 6.8 (6.1-7.5) | 0.5 (0.3-0.8) |
| JF Chen [21 ] | 5090 | 3.4 (2.9-3.9) | – | 3.7 (3.2-4.2) | 0.3 (0.2-0.5) |
| H Hu [22 ] | 5592 | 14.7 (13.8-15.7) | 1.6 (1.3-1.9) | 20.1 (19.0-21.1) | 5.4 (4.8-6.0) |
| XJ Zhang [ 23] | 1026 | – | – | – | 2.0 (1.3-3.0) |
| S Liu [24 ] | 5079 | 7.6 (6.9-8.4) | – | 12.9 (12.0-13.9) | 5.3 (4.8-6.0) |
| L Li [25 ] | 3040 | 1.8 (1.4-2.4) | – | 3.2 (2.6.-3.9) | 1.4 (1.0-1.8) |
| S Wu [26 ] | 3428 | 7.9 (7.1-8.9) | 2.6 (2.1-3.2) | 10.6 (9.6-11.7) | 2.7 (2.2-3.3) |
| ZJ Li [27 ] | 5057 | 8.3 (7.6-9.1) | – | 10.2 (9.4-11.1) | 1.9 (1.6-2.3) |
| J Zhou [65 ] | 1305 | 18.6 (16.6-20.8) | – | 25.8 (23.4-28.2) | 7.1 (5.9-8.7) |
| XW Tong [66 ] | 4545 | 8.8 (8.2-9.4) | – | 9.7 (8.9-10.6) | 0.9 (0.6-1.2) |
| YT Tang [67 ] | 8317 | 8.8 (8.2-9.4) | – | 10.0 (9.3-10.6) | 1.2 (1.0-1.5) |
| J Li [68 ] | 2133 | 15.2 (13.8-16.8) | – | 18.8 (17.2-20.5) | 3.6 (2.9-4.5) |
| XF Li [69 ] | 4012 | 9.5 (8.6-10.4) | – | 10.9 (10.0-11.9) | 1.2 (0.9-1.6) |
| JL Zhao (2014) [9] | 51310 | 10.3 (10.0-10.6) | – | 12.0 (11.7-12.2) | 1.7 (1.6-1.8) |
| RR Zhu [17] | 5947 | 23.6 (22.6-24.7) | 2.0 (1.7-2.4) | 26.0 (24.9-27.1) | 2.3 (2.0-2.7) |
| 6106 | 5.4 (4.8-6.0) | 0.5 (0.3-0.7) | 6.3 (5.7-6.9) | 0.9 (0.7-1.2) | |
| M Yang [70 ] | 5947 | 23.6 (22.6-24.7) | 2.0 (1.7-2.4) | 25.9 (24.8-27.1) | 2.3 (2.0-2.7) |
| MC Yi [71 ] | 3086 | 12.5 (11.3-13.7) | 2.3 (1.8-2.9) | 15.3 (14.1-16.6) | 2.9 (2.3-3.5) |
| JY Hu [72 ] | 653 | 16.5 (13.9-19.6) | – | 22.5 (19.5-25.9) | 6.0 (4.4-8.1) |
| W Zhou [73 ] | 3497 | 14.8 (13.6-16.0) | – | 15.9 (14.7-17.1) | 1.1 (0.8-1.5) |
| LH Wang [74 ] | 17816 | 7.0 (6.6-7.4) | – | 8.6 (8.2-9.0) | 1.6 (1.4-1.8) |
| W Wang [77 ] | 2150 | 21.7 (20.0-23.5) | – | 23.7 (22.0-25.6) | 2.0 (1.5-2.7) |
| CJ Liu [78 ] | 15238 | 14.5 (14.0-15.1) | 1.0 (0.7-1.2) | 16.2 (15.6-16.8) | 1.7 (1.5-1.9) |
| LL Deng [79 ] | 5119 | 17.0 (16.0-18.1) | – | 19.2 (18.1-20.3) | 2.2 (1.8-2.6) |
| JH Zhou [80 ] | 5151 | 14.1 (13.2-15.1) | – | 17.8 (16.8-18.9) | 3.7 (3.2-4.3) |
| M Wu [81 ] | 2842 | – | – | – | 2.0 (1.6-2.6) |
| JL Zhao (2006) [10] | 45747 | 10.8 (10.5-11.1) | – | 13.1 (12.8-13.4) | 2.3 (2.2-2.4) |
| SS Huang [ 75] | 1399 | 10.1 (8.6-11.8) | 0.6 (0.3-1.2) | 10.7 (9.2-12.4) | 0.6 (0.3-1.2) |
| BJ Hou [76 ] | 2060 | 7.9 (6.8-9.2) | – | 18.5 (16.9-20.3) | 10.6 (9.4-12.0) |
| M Wu [81 ] | 2588 | – | – | – | 3.7 (3.0-4.5) |
| XB Huang [ 83] | 3851 | 26.8 (25.4-28.2) | – | 33.9 (32.4-35.4) | 7.2 (6.4-8.0) |
| WL Song [84 ] | 3525 | 9.8 (8.9-10.8) | – | 12.3 (11.3-13.5) | 2.6 (2.1-3.2) |
| XJ Xiong [ 85] | 2122 | 11.2 (9.9-12.6) | 0.9 (0.5-1.3) | 15.2 (13.7-16.8) | 4.0 (3.3-4.9) |
| YB Liang [ 86] | 4241 | 8.5 (7.7-9.4) | – | 10.0 (9.1-10.9) | 1.5 (1.2-1.9) |
| Pooled prevalence | 250080 | 10.9 (9.4-12.6) | 2.7(1.9-3.8) | 13.6 (11.8-15.6) | 2.2 (1.8-2.8) |
MSVI – moderate and severe visual impairment, SVI – severe visual impairment, VI – visual impairment
Prevalence of MSVI and blindness among Chinese population by using BCVA
Table 3 and Figure S1 in the Online Supplementary Document (Panels G and H) shows the reported prevalence of MSVI ranged from 1.3% to 32.0% in terms of BCVA [47,96], and for blindness from 0.4% to 8.7% [56,76]. The pooled prevalence of MSVI and blindness was 5.4% (95% CI = 4.6%-6.2%) and 2.2% (95% CI = 1.9%-2.5%), respectively. Meanwhile, the pooled prevalence of SVI was 1.4% (95% CI = 1.0%-1.9%) and VI prevalence was 7.8% (95% CI = 6.9%-8.9%).
| First author | No. of older adults | Best corrected visual acuity | |||
|---|---|---|---|---|---|
| MSVI | SVI | VI | Blindness | ||
| Nancy Chen [28 ] | 2316 | 4.1 (3.3-4.9) | – | 4.9 (4.1-5.8) | 0.8 (0.5-1.3) |
| T Li [29 ] | 17473 | 1.4 (1.2-1.6) | – | 2.0 (1.8-2.2) | 0.6 (0.5-0.8) |
| Y Yao [30 ] | 6155 | 3.5 (3.1-4.0) | – | 6.8 (6.1-7.4) | 3.3 (2.9-3.7) |
| GS Zhang [31 ] | 4928 | 13.2 (12.3-14.2) | – | 19.8 (18.7-20.9) | 6.6 (5.9-7.3) |
| YG Zhang [32 ] | 2728 | 4.6 (3.9-5.5) | – | 6.8 (5.9-7.8) | 2.2 (1.7-2.8) |
| GP Duan [33 ] | 4857 | 4.5 (4.0-5.2) | – | 6.5 (5.8-7.2) | 1.9 (1.6-2.3) |
| GP Duan [34 ] | 4402 | 4.9 (4.3-5.6) | – | 7.2 (6.5-8.0) | 2.3 (1.9-2.7) |
| J Fu [35 ] | 5235 | 7.2 (6.5-8.0) | – | 10.8 (10.0-11.7) | 3.6 (3.1-4.1) |
| YH Gu [18] | 987 | 2.5 (1.7-3.6) | – | 7.8 (6.3-9.6) | 5.3 (4.1-6.9) |
| 1386 | 2.0 (1.4-2.9) | – | 4.9 (3.9-6.2) | 2.9 (2.1-3.9) | |
| XY Huang [36 ] | 4329 | 6.8 (6.1-7.6) | – | 9.0 (8.2-9.9) | 2.2 (1.8-2.7) |
| Y Huang [37 ] | 4260 | 7.7 (7.0-8.6) | – | 10.5 (9.6-11.5) | 2.8 (2.3-3.3) |
| JP Liu [38 ] | 705 | 5.3 (3.8-7.2) | – | 9.4 (7.4-11.7) | 4.1 (2.9-5.9) |
| XP Liu [39 ] | 4539 | 7.0 (6.3-7.7) | – | 9.1 (8.3-10.0) | 2.2 (1.8-2.6) |
| XY Ma [40 ] | 2299 | 7.2 (6.2-8.4) | – | 10.0 (8.8-11.3) | 2.8 (2.2-3.5) |
| M NA Bijiang [ 41] | 2853 | 4.7 (4.0-5.5) | – | 6.8 (6.0-7.8) | 2.1 (1.7-2.7) |
| Mehriban Yusup [42] | 2382 | 9.0 (7.9-10.2) | – | 14.8 (13.4-16.3) | 5.8 (5.0-6.9) |
| YJ Meng [43 ] | 5520 | 5.3 (4.7-5.9) | – | 10.1 (9.3-10.9) | 4.8 (4.3-5.4) |
| JZ Pei [44 ] | 1912 | 8.1 (7.0-9.4) | – | 9.6 (8.3-11.0) | 1.5 (1.0-2.1) |
| H Qi [45 ] | 4785 | 13.5 (12.6-14.5) | – | 15.9 (14.9-16.9) | 2.3 (1.9-2.8) |
| LF Qiao [46 ] | 2817 | 15.1 (13.8-16.5) | 2.5 (1.9-3.1) | 19.1 (17.7-20.6) | 3.9 (3.3-4.7) |
| FR Shen [47 ] | 6769 | 1.3 (1.1-1.6) | – | 2.5 (2.1-2.9) | 1.2 (0.9-1.5) |
| B Shen [48 ] | 6302 | 9.3 (8.6-10.0) | – | 10.7 (10.0-11.5) | 1.5 (1.2-1.8) |
| W Sun [49 ] | 6150 | 3.5 (3.0-4.0) | – | 6.8 (6.1-7.4) | 3.3 (2.9-3.7) |
| GM Wang [50 ] | 4916 | 5.3 (4.7-6.0) | – | 7.7 (7.0-8.4) | 2.4 (2.0-2.8) |
| XL Wu [51 ] | 5448 | 3.3 (2.9-3.9) | – | 4.3 (3.8-3.9) | 1.0 (0.7-1.2) |
| LJ Tang [52 ] | 2600 | 17.7 (16.3-19.2) | – | 21.7 (20.2-23.4) | 4.0 (3.3-4.9) |
| SS Zhang [53 ] | 5564 | 12.7 (11.9-13.6) | – | 13.6 (12.7-14.5) | 0.9 (0.7-1.2) |
| J Zhang [54 ] | 1284 | – | – | – | 5.1 (4.1-6.5) |
| XJ Zhang [55 ] | 3484 | 8.0 (7.2-9.0) | 1.1 (0.8-1.5) | 10.5 (9.5-11.5) | 2.4 (2.0-3.0) |
| L Xu [56 ] | 2987 | 1.5 (1.1-2.0) | – | 1.9 (1.5-2.5) | 0.4 (0.2-0.7) |
| L Chen [57 ] | 1765 | 3.5 (2.7-4.5) | – | 6.2 (5.2-7.4) | 2.7 (2.0-3.6) |
| CX Qi [58 ] | 4126 | 8.4 (7.6-9.3) | – | 14.4 (13.3-15.5) | 6.0 (5.3-6.7) |
| LL Yang [59 ] | 11210 | 8.3 (7.8-8.8) | – | 12.7 (12.1-13.4) | 4.5 (4.1-4.8) |
| M Wei [60 ] | 41441 | 1.4 (1.3-1.5) | – | 3.8 (3.6-4.0) | 2.4 (2.2-2.5) |
| XF Gao [61 ] | 7499 | 1.3 (1.1-1.6) | – | 2.0 (1.7-2.4) | 0.7 (0.5-0.9) |
| X Zhao [62 ] | 2410 | 5.9 (5.1-6.9) | – | 9.3 (8.2-10.6) | 3.4 (2.7-4.2) |
| TY Xie [63 ] | 2955 | 10.1 (8.8-11.5) | – | 16.9 (15.2-18.6) | 6.7 (5.7-7.9) |
| TZ Zhang [64 ] | 1208 | 8.4 (6.6-10.7) | – | 10.6 (8.6-13.0) | 2.2 (1.3-3.5) |
| J Zhou [65 ] | 1305 | 9.4 (7.9-11.1) | – | 13.4 (11.7-15.4) | 4.1 (3.1-5.3) |
| XW Tong [66 ] | 4545 | 3.2 (2.7-3.7) | – | 3.9 (3.3-4.5) | 0.7 (0.5-0.9) |
| YT Tang [67 ] | 10234 | 5.9 (5.4-6.4) | – | 7.0 (6.5-7.6) | 1.1 (0.9-1.4) |
| J Li [68 ] | 2133 | 7.8 (6.7-9.0) | – | 10.6 (9.4-12.0) | 2.9 (2.2-3.7) |
| XF Li [69 ] | 20298 | 5.7 (5.1-6.5) | – | 6.6 (5.9-7.4) | 0.9 (0.6-1.2) |
| JL Zhao (2014) [9] | 51310 | 4.5 (4.3-4.6) | – | 5.9 (5.7-6.1) | 1.4 (1.3-1.5) |
| RR Zhu [17] | 5947 | 6.4 (5.8-7.1) | 0.7 (0.6-1.0) | 8.1 (7.4-8.8) | 1.7 (1.4-2.0) |
| 6106 | 2.4 (2.1-2.8) | 0.2 (0.1-0.4) | 3.2 (2.7-3.6) | 0.8 (0.6-1.0) | |
| M Yang [70 ] | 5947 | 6.4 (5.8-7.1) | 0.7 (0.6-1.0) | 8.0 (7.3-8.7) | 1.6 (1.3-1.9) |
| MC Yi [71 ] | 3086 | 6.5 (5.7-7.4) | 1.0 (0.7-1.4) | 8.8 (7.9-9.9) | 2.3 (1.8-2.9) |
| JY Hu [72 ] | 653 | 4.3 (3.0-6.1) | – | 7.5 (5.7-9.8) | 3.2 (2.1-4.9) |
| W Zhou [73 ] | 3497 | 4.0 (3.4-4.7) | – | 4.9 (4.2-5.6) | 0.7 (0.5-1.1) |
| LH Wang [74 ] | 17816 | 3.7 (3.4-4.7) | – | 5.0 (4.7-5.3) | 1.3 (1.2-1.5) |
| W Wang [77 ] | 2150 | 8.2 (7.1-9.4) | – | 9.8 (8.6-11.1) | 1.6 (1.2-2.3) |
| CJ Liu [78 ] | 15238 | 3.5 (3.3-3.8) | – | 5.0 (4.6-5.3) | 1.4 (1.2-1.6) |
| LL Deng [79 ] | 5119 | 7.2 (6.5-7.9) | – | 8.6 (7.9-9.4) | 1.5 (1.2-1.8) |
| JH Zhou [80 ] | 5151 | 7.7 (7.0-8.5) | – | 13.1 (12.2-14.0) | 5.3 (4.8-6.0) |
| M Wu [81 ] | 2842 | – | – | – | 2.3 (1.8-2.9) |
| JL Zhao (2006) [10] | 45747 | 5.3 (5.1-5.5) | – | 7.23 (7.0-7.5) | 1.9 (1.8-2.1) |
| SS Huang [75 ] | 1399 | 3.1 (2.3-4.1) | 0.1 (0-0.5) | 3.6 (2.7-4.7) | 0.5 (0.2-1.0) |
| BJ Hou [76 ] | 3071 | 4.8 (4.0-5.8) | – | 13.6 (12.1-15.1) | 8.7 (7.6-10.0) |
| M Wu [82 ] | 2588 | – | – | – | 3.2 (2.6-3.9) |
| XB Huang [83 ] | 3851 | 14.6 (13.5-15.7) | – | 17.1 (15.9-18.3) | 2.5 (2.0-3.0) |
| WL Song [84 ] | 4956 | 6.6 (5.9-7.5) | – | 9.1 (8.1-10.0) | 2.4 (2.4-2.0) |
| XJ Xiong [85 ] | 2122 | 6.2 (5.2-7.3) | 0.8 (0.5-1.2) | 8.0 (6.9-9.2) | 1.8 (1.3-2.5) |
| YB Liang [86 ] | 6830 | 2.6 (2.2-3.1) | – | 3.8 (3.3-4.4) | 1.2 (0.9-1.6) |
| Pooled prevalence | 438927 | 5.4 (4.6-6.2) | 1.4 (1.0-1.9) | 7.8 (6.9-8.9) | 2.2 (1.9-2.5) |
MSVI – moderate and severe visual impairment, SVI – severe visual impairment, VI – visual impairment
Subgroup analyses of the pooled prevalence of VI and blindness
Table 4 shows the subgroup analyses of MSVI and blindness among Chinese population by PVA and BCVA.
| Moderate and severe visual impairment | Blindness | ||||||||||||
|---|---|---|---|---|---|---|---|---|---|---|---|---|---|
| Subgroup | N | Prevalence and 95% CI (%) | Heterogeneity, I2 (%) | Q-value | P-value | N | Prevalence and 95% CI (%) | Heterogeneity, I2 (%) | Q-value | P-value | |||
| Prevalence by present visual acuity | |||||||||||||
| Gender: | |||||||||||||
| Female | 34 | 15.6 (12.7-18.9) | 99.568 | 7639.915 | <0.001 | 37 | 2.2 (1.9-2.7) | 96.271 | 965.294 | <0.001 | |||
| Male | 34 | 12.3 (10.0-15.2) | 99.378 | 5307.023 | 37 | 1.7 (1.3-2.1) | 96.596 | 1057.694 | |||||
| District: | |||||||||||||
| Rural | 35 | 14.9 (12.0-18.4) | 99.734 | 12760.453 | <0.001 | 38 | 2.2 (1.8-2.7) | 97.946 | 1801.707 | <0.001 | |||
| Urban | 6 | 9.0 (5.4-14.8) | 99.584 | 1202.177 | 7 | 2.2 (1.2-4.0) | 98.923 | 557.320 | |||||
| Geographical location: | |||||||||||||
| Central China | 3 | 19.7 (12.0-30.6) | 99.535 | 430.343 | <0.001 | 3 | 1.7 (1.3-2.4) | 85.850 | 14.134 | <0.001 | |||
| Eastern China | 32 | 12.3 (9.4-15.9) | 99.770 | 13482.959 | 33 | 1.6 (1.3-2.1) | 97.447 | 1253.332 | |||||
| Western China | 13 | 14.1 (10.6-18.3) | 99.480 | 2308.491 | 15 | 3.3 (2.5-4.4) | 97.901 | 666.884 | |||||
| Age: | |||||||||||||
| 50-59 | 36 | 5.4 (4.3-6.9) | 98.914 | 3223.944 | 0.165 | 38 | 0.7 (0.5-0.9) | 91.569 | 438.851 | <0.001 | |||
| 60-69 | 43 | 10.3 (8.1-12.9) | 99.318 | 6156.620 | 45 | 1.4 (1.0-1.9) | 96.445 | 1237.792 | |||||
| 70-79 | 39 | 25.3 (20.9-30.3) | 99.356 | 5902.461 | 41 | 3.5 (2.9-4.1) | 94.389 | 712.873 | |||||
| 80+ | 39 | 44.2 (36.3-52.4) | 99.286 | 5319.924 | 41 | 8.8 (7.1-11.0) | 96.407 | 1113.256 | |||||
| Educational level: | |||||||||||||
| Illiterate | 16 | 19.1 (15.9-22.8) | 98.598 | 1070.033 | <0.001 | 16 | 4.8 (3.6-6.4) | 96.551 | 434.917 | <0.001 | |||
| Primary school and lower | 20 | 9.7 (7.7-12.3) | 98.364 | 1161.541 | 19 | 1.7 (1.1-2.5) | 94.095 | 423.386 | |||||
| Secondary school and above | 25 | 6.9 (4.8-9.7) | 97.691 | 1161.378 | 26 | 1.7 (1.1-2.7) | 96.310 | 487.763 | |||||
| Examined year: | |||||||||||||
| 1999-2009 | 27 | 9.9 (8.4-11.8) | 99.027 | 2670.885 | <0.001 | 30 | 2.4 (1.9-3.0) | 97.858 | 1353.906 | <0.001 | |||
| 2010-2017 | 24 | 16.2 (12.6-20.5) | 99.763 | 9699.090 | 24 | 1.6 (1.2-2.1) | 97.647 | 977.293 | |||||
| Prevalence by best corrected visual acuity | |||||||||||||
| Gender: | |||||||||||||
| Female | 48 | 7.1 (5.9-8.4) | 99.029 | 4840.553 | <0.001 | 49 | 1.9 (1.6-2.3) | 97.391 | 1839.996 | <0.001 | |||
| Male | 48 | 5.6 (4.7-6.8) | 98.637 | 3447.731 | 49 | 1.6 (1.3-1.9) | 95.571 | 1083.737 | |||||
| District: | |||||||||||||
| Rural | 53 | 6.2 (5.2-7.3) | 99.199 | 6492.752 | <0.001 | 54 | 1.9 (1.6-2.3) | 97.563 | 2174.966 | <0.001 | |||
| Urban | 23 | 4.6 (3.5-6.2) | 99.280 | 3053.625 | 23 | 1.7 (1.3-2.3) | 97.807 | 1002.969 | |||||
| Geographical location: | |||||||||||||
| Central China | 11 | 4.3 (2.6-7.0) | 99.466 | 1872.103 | <0.001 | 11 | 2.0 (1.2-3.3) | 98.552 | 690.498 | <0.001 | |||
| Eastern China | 45 | 5.9 (4.9-7.1) | 99.312 | 6459.533 | 45 | 1.6 (1.3-1.9) | 97.311 | 1636.031 | |||||
| Western China | 22 | 7.2 (5.4-9.7) | 99.388 | 3429.291 | 25 | 2.9 (2.3-3.6) | 97.463 | 946.153 | |||||
| Age: | |||||||||||||
| 50-59 | 56 | 1.8 (1.5-2.2) | 95.091 | 1120.306 | <0.001 | 56 | 0.6 (0.4-0.8) | 94.379 | 978.466 | <0.001 | |||
| 60-69 | 67 | 4.3 (3.7-4.9) | 96.857 | 2100.172 | 68 | 1.4 (1.1-1.8) | 96.959 | 2203.248 | |||||
| 70-79 | 56 | 10.9 (9.0-13.0) | 98.793 | 4556.433 | 56 | 2.9 (2.4-3.5) | 96.118 | 1416.784 | |||||
| 80+ | 56 | 22.5 (18.1-27.6) | 99.086 | 6020.206 | 56 | 7.6 (6.2-9.3) | 96.149 | 1428.325 | |||||
| Education: | |||||||||||||
| Illiterate | 16 | 9.7 (8.2-11.5) | 96.010 | 375.901 | <0.001 | 16 | 3.4 (2.5-4.5) | 96.217 | 396.544 | <0.001 | |||
| Primary school and lower | 17 | 4.4 (3.2-5.2) | 97.325 | 598.045 | 17 | 1.4 (1.0-2.0) | 92.566 | 215.214 | |||||
| Secondary school and above | 23 | 3.6 (.4-5.2) | 96.319 | 597.665 | 23 | 1.1 (0.7-1.7) | 89.597 | 211.484 | |||||
| Examined year: | |||||||||||||
| 1999-2009 | 40 | 4.9 (4.1-6.0) | 98.993 | 3873.349 | <0.001 | 43 | 2.1 (1.8-2.6) | 97.764 | 1878.643 | <0.001 | |||
| 2010-2017 | 34 | 7.9 (6.5-9.6) | 99.321 | 4859.186 | 34 | 1.8 (1.4-2.2) | 97.915 | 1582.527 | |||||
CI – confidence interval
For MSVI, subgroup analyses using PVA for diagnosis presented similar results with that of BCVA. Gender difference is of statistical significance, as the prevalence of females (15.6%, 95% CI = 12.7%-18.9% for PVA; 7.1%, 95% CI = 5.9%-8.4% for BCVA) surpassed those of male (12.3%, 95% CI = 10.0%-15.2% for PVA; 5.6%, 95% CI = 4.7%-6.8% for BCVA). In geographical subgroup analysis, MSVI prevalence among the rural part of China is higher than the urban area (P < 0.001). Meanwhile, for the subgroup analysis of age group using PVA for diagnosis, the MSVI prevalence rose from 5.4% (95% CI = 4.3%-6.9%) in the 50-59 age group to 44.2% (36.3%-52.4%) in the 80+ age group, given by Figure 2 , Panel A. As for BCVA, prevalence of MSVI increased from 1.8% (95% CI = 1.5%-2.2%) to 22.5% (95% CI = 18.1%-27.6%) (P < 0.001). In terms of education level, populations that had obtained higher education were at a lower risk of developing MSVI both by PVA and BCVA (P < 0.001). As for survey year, studies conducted in early years (1999-2009) had a lower MSVI prevalence than those conducted later (2010-2017) with statistical significance by PVA and BCVA (P < 0.001). Studies conducted during 2010 and 2017 had a lower prevalence compared to those conducted between 1999 and 2009 with statistical significance ( P < 0.001).
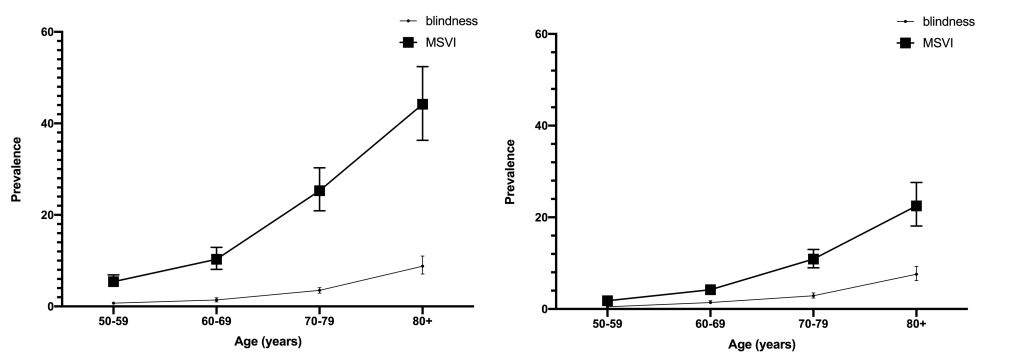
In the blindness subgroup analyses, some results were similar to MSVI, as females, rural residents, and lower educational level were risk factors of developing blindness (P < 0.001). For example, the blindness prevalence by PVA climbed up from 0.7% (95% CI = 0.5%-0.9%) among 50-59 age group to 8.8% (7.1%-11.0%) among individuals over 80 years old ( Figure 2 , Panel-B). However, people dwelling in Western China were more likely to develop blindness by PVA (3.3%, 95% CI = 2.5%-4.4%, P < 0.001). Unlike MSVI, studies conducted during 2010 and 2017 had a lower prevalence compared to those conducted between 1999 and 2009 with statistical significance ( P < 0.001).
In our study, 72 studies with 90 data sets conducted in different parts of China were included, and the pooled prevalence of VI, MSVI, SVI and blindness among older Chinese populations (aged 50 years and above) were assessed. Using PVA as the classification index, prevalence of MSVI, SVI, VI and blindness were, 10.9% (95% CI = 9.4%-12.6%), 2.7% (95% CI = 1.9%-3.8%), 13.6% (95% CI: 11.8%-15.6%) and 2.2% (95% CI = 1.8%-2.8%), respectively. As for BCVA, the pooled MSVI, SVI, VI and blindness prevalence were, 5.4% (95% CI = 4.6%-6.2%), 1.4% (95% CI = 1.0%-1.9%), 7.8% (95% CI = 6.9%-8.9%) and 2.2% (95% CI: 1.9%-2.5%), respectively. Generally, the results of this meta-analysis are consistent with prior studies showing that blindness and MSVI occur more frequently among the older Chinese population [2,11,12 ].
In the subgroup analysis of gender, the pooled prevalence of females was much higher than that of male, in accordance with most of the original investigations. One possible explanation could be the longer life expectancy of females, which accounts for higher risk of developing age-related ocular diseases [ 1,3]. Additionally, anatomical and hormonal differences may contribute to the gender difference, as females are proved to be at higher risk of developing cataract, one of the common ocular diseases that leads to MSVI and blindness, but the mechanism is yet to be elucidated [97-99]. Also, the social status of females is much lower in some remote areas, leading to lower quality of health care.
Residing in specific geographical area may contribute to the development of blindness and MSVI; in this study dwelling in rural areas or Western China is considered to be an important risk factor. One explanation is the shortage of health care services in less developed and geographically remote places. Lack of health awareness is also a significant factor among rural residents [100]. The pooled MSVI prevalence of Central China seems higher than those of Western and Eastern China by PVA, however, this may be caused by the limited included studies conducted in Central China. Therefore, these results could assist in guiding the development and implementation of health care resources and policies to focus more on rural populations and promoting health awareness.
The significant difference of the prevalence of MSVI and blindness in the 4 age groups should be highlighted. The pooled prevalence rate were 10 times higher in the 80+ age group than the 50-59 age group. As we know, MSVI and blindness are mainly caused by age-related ocular diseases [1,3,4]. Screenings and early diagnosis methods are vital for reducing the prevalence of MSVI and blindness, and will improve the quality of life of older populations.
When comparing groups of education levels, individuals with higher education were less likely to suffer from MSVI and blindness. Education level is considered to be strongly correlated with socioeconomic status, which is correlated with access to quality medical services [ 101,102]. Higher education may also be linked to a better understanding and awareness of MSVI and blindness, resulting in timely treatment after the appearance of relevant symptoms [103,104]. Educational intervention plays an important role in raising awareness of the severity of MSVI and blindness in the general population.
In our study, the prevalence of MSVI is trending upward while the prevalence of blindness is downward trending when comparing studies surveyed in 1999-2009 with those conducted in 2010-2017. While the cataract surgery rate is trending upward, and the awareness of blindness prevention may help with the reducing of MSVI prevalence [105], the aging population is linked with more individuals at risk of blindness causing ocular diseases, such as age-related macular degeneration and diabetic retinopathy, where treatment in late-stage progression is often of limited efficacy [16,106]. Multiple strategies should be utilized to mitigate these problems, such as better screening strategies and improved education around preventing MSVI and blindness to the general public.
The strength of this meta-analysis lies in the large pooled sample size from a wide geographical distribution. In addition, this is one of the few meta-analyses that includes a significant amount of recently published Chinese studies, allowing for researchers worldwide to assess the current situation of MSVI and blindness among older Chinese populations. Moreover, our study is the first to include both PVA and BCVA. The quality assessment of all included studies with clearly defined evaluation tools should also be highlighted, ensuring the quality of this meta-analysis.
However, several limitations should be considered. Some relevant information in subgroup analysis, such as education level, was not available in all selected articles, which could affect the results to a certain extent. Meanwhile, although the Egger’s tests and funnel plot did not suggest any publication bias, Begg’s tests indicated potential bias may exist in pooled prevalence of blindness and MSVI by BCVA, which may have some impact on the results. Additionally, although we have included both PVA and BCVA as a diagnosis index, using PVA and BCVA in one study is not as common, which may influence the analysis process. The comparison of the accuracy and practicability of PVA and BCVA was not able to be conducted this time, though we will consider this in future studies.
In conclusion, this meta-analysis offers a comprehensive and up-to-date estimate of MSVI and blindness among older Chinese populations, with the subgroups of gender, district, geographical location, education level and survey year analyzed. The results of this meta-analysis indicate that the prevalence of MSVI and blindness remains high and with discrepancy in different subgroups. Further studies are needed to explore improved diagnosis methods and the mechanism of risk factors affecting MSVI and blindness prevalence.